United Airlines 2010 Annual Report Download - page 110
Download and view the complete annual report
Please find page 110 of the 2010 United Airlines annual report below. You can navigate through the pages in the report by either clicking on the pages listed below, or by using the keyword search tool below to find specific information within the annual report.-
 1
1 -
2
-
3
-
4
-
5
-
6
-
7
-
8
-
9
-
10
-
11
-
12
-
13
-
14
-
15
-
16
-
17
-
18
-
19
-
20
-
21
-
22
-
23
-
24
-
25
-
26
-
27
-
28
-
29
-
30
-
31
-
32
-
33
-
34
-
35
-
36
-
37
-
38
-
39
-
40
-
41
-
42
-
43
-
44
-
45
-
46
-
47
-
48
-
49
-
50
-
51
-
52
-
53
-
54
-
55
-
56
-
57
-
58
-
59
-
60
-
61
-
62
-
63
-
64
-
65
-
66
-
67
-
68
-
69
-
70
-
71
-
72
-
73
-
74
-
75
-
76
-
77
-
78
-
79
-
80
-
81
-
82
-
83
-
84
-
85
-
86
-
87
-
88
-
89
-
90
-
91
-
92
-
93
-
94
-
95
-
96
-
97
-
98
-
99
-
 100
100 -
 101
101 -
 102
102 -
 103
103 -
 104
104 -
 105
105 -
 106
106 -
 107
107 -
 108
108 -
 109
109 -
 110
110 -
 111
111 -
 112
112 -
 113
113 -
 114
114 -
 115
115 -
 116
116 -
 117
117 -
 118
118 -
 119
119 -
 120
120 -
121
-
122
-
123
-
124
-
125
-
126
-
127
-
128
-
129
-
130
-
131
-
132
-
133
-
134
-
135
-
136
-
137
-
138
-
139
-
140
-
141
-
142
-
143
-
144
-
145
-
146
-
147
-
148
-
149
-
150
-
151
-
152
-
153
-
154
-
155
-
156
-
157
-
158
-
159
-
160
-
161
-
162
-
163
-
164
-
165
-
166
-
167
-
168
-
169
-
170
-
171
-
172
-
173
-
174
-
175
-
176
-
177
-
178
-
179
-
180
-
181
-
182
-
183
-
184
-
185
-
186
-
187
-
188
-
189
-
190
-
191
-
192
-
193
-
194
-
195
-
196
-
197
-
198
-
199
-
200
-
201
-
202
-
203
-
204
-
205
-
206
-
207
-
208
-
209
-
210
-
211
-
212
-
213
-
214
-
215
-
216
-
217
-
218
-
219
-
220
-
221
-
222
-
223
-
224
 |
 |

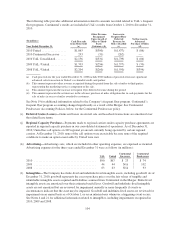
(a) Weighted average life expressed in years.
(b) The United and Continental frequent flyer databases are amortized based on an accelerated amortization schedule to
reflect utilization of the assets. Estimated cash flows correlating to the expected attrition rate of customers in the frequent
flyer databases were considered in the determination of the amortization schedules.
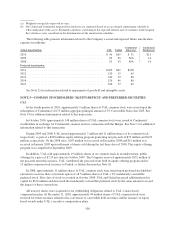
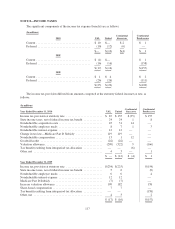
The following table presents information related to the Company’s actual and expected future amortization
expense (in millions):
Actual Amortization: UAL United
Continental
Successor
Continental
Predecessor
2010 .................................................... $ 96 $65 $ 31 $11
2009 .................................................... 69 69 N/A 14
2008 .................................................... 92 92 N/A 14
Projected Amortization:
2011 .................................................... $169 $61 $108
2012 .................................................... 120 55 65
2013 .................................................... 140 52 88
2014 .................................................... 126 46 80
2015 .................................................... 106 37 69
See Note 21 for information related to impairment of goodwill and intangible assets.
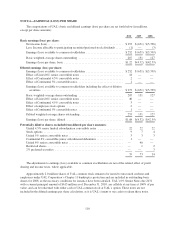
NOTE 5—COMMON STOCKHOLDERS’ EQUITY(DEFICIT) AND PREFERRED SECURITIES
UAL
In the fourth quarter of 2010, approximately 9 million shares of UAL common stock were issued upon the
redemption of Continental’s $175 million aggregate principal amount of 5% Convertible Notes due 2023. See
Note 14 for additional information related to this transaction.
In October 2010, approximately 148 million shares of UAL common stock were issued to Continental
stockholders in exchange for Continental common stock in connection with the Merger. See Note 1 for additional
information related to this transaction.
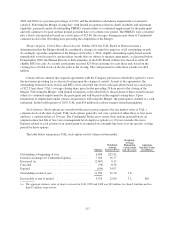
During 2009 and 2008, UAL issued approximately 7 million and 11 million shares of its common stock,
respectively, as part of a $200 million equity offering program generating net proceeds of $75 million and $122
million, respectively. Of the 2008 sales, $107 million was received in December 2008 and $15 million was
received in January 2009 upon settlement of shares sold during the last three days of 2008. This equity offering
program was completed in September 2009.
In addition, UAL sold approximately 19 million shares of its common stock in an underwritten, public
offering for a price of $7.24 per share in October 2009. The Company received approximately $132 million of
net proceeds from this issuance. UAL contributed the proceeds from both its equity offering program and its
19 million common stock issuance to United, as further discussed in Note 20.
In 2008, approximately 11 million shares of UAL common stock were issued upon preferred stockholders’
elections to exercise their conversion option of all 5 million shares of UAL’s 2% mandatorily convertible
preferred stock. This class of stock was retired in October 2008. UAL and United increased additional paid in
capital by $374 million and decreased the mandatorily convertible preferred stock by the same amount to record
the impact of these conversions.
All treasury shares were acquired for tax withholding obligations related to UAL’s share-based
compensation plan. At December 31, 2010, approximately 94 million shares of UAL common stock were
reserved for future issuance related to the conversion of convertible debt securities and the issuance of equity
based awards under UAL’s incentive compensation plans.
108