United Airlines 2010 Annual Report Download - page 72
Download and view the complete annual report
Please find page 72 of the 2010 United Airlines annual report below. You can navigate through the pages in the report by either clicking on the pages listed below, or by using the keyword search tool below to find specific information within the annual report.-
 1
1 -
2
-
3
-
4
-
5
-
6
-
7
-
8
-
9
-
10
-
11
-
12
-
13
-
14
-
15
-
16
-
17
-
18
-
19
-
20
-
21
-
22
-
23
-
24
-
25
-
26
-
27
-
28
-
29
-
30
-
31
-
32
-
33
-
34
-
35
-
36
-
37
-
38
-
39
-
40
-
41
-
42
-
43
-
44
-
45
-
46
-
47
-
48
-
49
-
50
-
51
-
52
-
53
-
54
-
55
-
56
-
57
-
58
-
59
-
60
-
61
-
 62
62 -
 63
63 -
 64
64 -
 65
65 -
 66
66 -
 67
67 -
 68
68 -
 69
69 -
 70
70 -
 71
71 -
 72
72 -
 73
73 -
 74
74 -
 75
75 -
 76
76 -
 77
77 -
 78
78 -
 79
79 -
 80
80 -
 81
81 -
 82
82 -
83
-
84
-
85
-
86
-
87
-
88
-
89
-
90
-
91
-
92
-
93
-
94
-
95
-
96
-
97
-
98
-
99
-
100
-
101
-
102
-
103
-
104
-
105
-
106
-
107
-
108
-
109
-
110
-
111
-
112
-
113
-
114
-
115
-
116
-
117
-
118
-
119
-
120
-
121
-
122
-
123
-
124
-
125
-
126
-
127
-
128
-
129
-
130
-
131
-
132
-
133
-
134
-
135
-
136
-
137
-
138
-
139
-
140
-
141
-
142
-
143
-
144
-
145
-
146
-
147
-
148
-
149
-
150
-
151
-
152
-
153
-
154
-
155
-
156
-
157
-
158
-
159
-
160
-
161
-
162
-
163
-
164
-
165
-
166
-
167
-
168
-
169
-
170
-
171
-
172
-
173
-
174
-
175
-
176
-
177
-
178
-
179
-
180
-
181
-
182
-
183
-
184
-
185
-
186
-
187
-
188
-
189
-
190
-
191
-
192
-
193
-
194
-
195
-
196
-
197
-
198
-
199
-
200
-
201
-
202
-
203
-
204
-
205
-
206
-
207
-
208
-
209
-
210
-
211
-
212
-
213
-
214
-
215
-
216
-
217
-
218
-
219
-
220
-
221
-
222
-
223
-
224
 |
 |
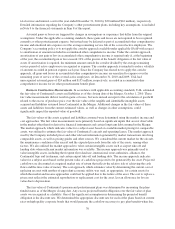
total service and interest cost for the year ended December 31, 2010 by $20 million/($16 million), respectively.
Detailed information regarding the Company’s other postretirement plans, including key assumptions, is included
in Note 9 to the financial statements in Item 8 of this report.
Actuarial gains or losses are triggered by changes in assumptions or experience that differ from the original
assumptions. Under the applicable accounting standards, those gains and losses are not required to be recognized
currently as other postretirement expense, but instead may be deferred as part of accumulated other comprehensive
income and amortized into expense over the average remaining service life of the covered active employees. The
Company’s accounting policy is to not apply the corridor approach available under applicable GAAP with respect
to amortization of amounts included in accumulated other comprehensive income. Under the corridor approach,
amortization of any gain or loss in accumulated other comprehensive income is required only if, at the beginning
of the year, the accumulated gain or loss exceeds 10% of the greater of the benefit obligation or the fair value of
assets. If amortization is required, the minimum amount outside the corridor divided by the average remaining
service period of active employees is recognized as expense. The corridor approach is intended to reduce volatility
of amounts recorded in pension expense each year. Since the Company has elected not to apply the corridor
approach, all gains and losses in accumulated other comprehensive income are amortized to expense over the
remaining years of service of the covered active employees. At December 31, 2010 and 2009, UAL had
unrecognized actuarial gains of $24 million and $155 million, respectively, recorded in accumulated other
comprehensive income for its other postretirement benefit plans.
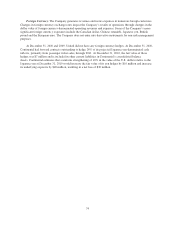
Business Combination Measurements. In accordance with applicable accounting standards, UAL estimated
the fair value of Continental’s assets and liabilities as of the closing date of the Merger, October 1, 2010. These
fair value measurements did not result in gains or losses, but were instead an input to the calculation of goodwill
related to the excess of purchase price over the fair value of the tangible and identifiable intangible assets
acquired and liabilities assumed from Continental in the Merger. Additional changes in the fair values of these
assets and liabilities from the current estimated values, as well as changes in other assumptions, could
significantly impact the reported value of goodwill.
The fair values of the assets acquired and liabilities assumed were determined using the market, income and
cost approaches. The fair value measurements were primarily based on significant inputs that are not observable
in the market other than for derivative financial instruments and certain long-term debt assumed in the Merger.
The market approach, which indicates value for a subject asset based on available market pricing for comparable
assets, was utilized to estimate the fair value of Continental’s aircraft and operating leases. The market approach
used by the Company included prices and other relevant information generated by market transactions involving
comparable assets, as well as pricing guides and other sources. We considered the current market for the aircraft,
the maintenance condition of the aircraft and the expected proceeds from the sale of the assets, among other
factors. We also utilized the market approach to value certain intangible assets such as airport take-off and
landing slots when sufficient market information was available. The income approach was primarily used to
value intangible assets, including the frequent flyer database, international route authorities, alliances, the
Continental logo and tradename, and certain airport take-off and landing slots. The income approach indicates
value for a subject asset based on the present value of cash flows projected to be generated by the asset. Projected
cash flows are discounted at a required market rate of return that reflects the relative risk of achieving the cash
flows and the time value of money. The cost approach, which estimates value by determining the current cost of
replacing an asset with another of equivalent economic utility, was used, as appropriate, for certain assets for
which the market and income approaches could not be applied due to the nature of the asset. The cost to replace a
given asset reflects the estimated reproduction or replacement cost for the asset, less an allowance for loss in
value due to depreciation.
The fair value of Continental’s pension and postretirement plans was determined by measuring the plans
funded status as of the Merger closing date. Any excess projected benefit obligation over the fair value of plan
assets was recognized as a liability. One of the significant assumptions in determining the projected benefit
obligation is the discount rate. We determined the appropriate discount rate for each of the plans based on current
rates on high quality corporate bonds that would generate the cash flow necessary to pay plan benefits when due,
70