United Airlines 2010 Annual Report Download - page 131
Download and view the complete annual report
Please find page 131 of the 2010 United Airlines annual report below. You can navigate through the pages in the report by either clicking on the pages listed below, or by using the keyword search tool below to find specific information within the annual report.-
 1
1 -
2
-
3
-
4
-
5
-
6
-
7
-
8
-
9
-
10
-
11
-
12
-
13
-
14
-
15
-
16
-
17
-
18
-
19
-
20
-
21
-
22
-
23
-
24
-
25
-
26
-
27
-
28
-
29
-
30
-
31
-
32
-
33
-
34
-
35
-
36
-
37
-
38
-
39
-
40
-
41
-
42
-
43
-
44
-
45
-
46
-
47
-
48
-
49
-
50
-
51
-
52
-
53
-
54
-
55
-
56
-
57
-
58
-
59
-
60
-
61
-
62
-
63
-
64
-
65
-
66
-
67
-
68
-
69
-
70
-
71
-
72
-
73
-
74
-
75
-
76
-
77
-
78
-
79
-
80
-
81
-
82
-
83
-
84
-
85
-
86
-
87
-
88
-
89
-
90
-
91
-
92
-
93
-
94
-
95
-
96
-
97
-
98
-
99
-
100
-
101
-
102
-
103
-
104
-
105
-
106
-
107
-
108
-
109
-
110
-
111
-
112
-
113
-
114
-
115
-
116
-
117
-
118
-
119
-
120
-
 121
121 -
 122
122 -
 123
123 -
 124
124 -
 125
125 -
 126
126 -
 127
127 -
 128
128 -
 129
129 -
 130
130 -
 131
131 -
 132
132 -
 133
133 -
 134
134 -
 135
135 -
 136
136 -
 137
137 -
 138
138 -
 139
139 -
 140
140 -
 141
141 -
142
-
143
-
144
-
145
-
146
-
147
-
148
-
149
-
150
-
151
-
152
-
153
-
154
-
155
-
156
-
157
-
158
-
159
-
160
-
161
-
162
-
163
-
164
-
165
-
166
-
167
-
168
-
169
-
170
-
171
-
172
-
173
-
174
-
175
-
176
-
177
-
178
-
179
-
180
-
181
-
182
-
183
-
184
-
185
-
186
-
187
-
188
-
189
-
190
-
191
-
192
-
193
-
194
-
195
-
196
-
197
-
198
-
199
-
200
-
201
-
202
-
203
-
204
-
205
-
206
-
207
-
208
-
209
-
210
-
211
-
212
-
213
-
214
-
215
-
216
-
217
-
218
-
219
-
220
-
221
-
222
-
223
-
224
 |
 |
accordance with applicable accounting rules for multi-employer plans, the participating company would only
recognize a withdrawal obligation if it becomes probable it would withdraw from such plan.
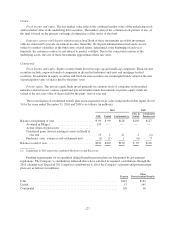
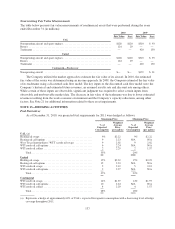
Profit Sharing Plans
UAL, United, Continental Successor and Continental Predecessor recorded profit sharing and related payroll
tax expense of $166 million, $165 million, less than $1 million and $77 million, respectively, in 2010. Profit
sharing expense is recorded as a component of salaries and related costs in the consolidated statements of
operations. The Company did not record profit sharing expense in 2009 or 2008 due to pretax losses. During
2010, United and Continental maintained separate employee profit sharing plans for the employees of each
respective subsidiary. United’s profit sharing plan pays 15% of total GAAP pre-tax profits, excluding special
items and stock compensation expense, to the employees of United when pre-tax profit excluding special items,
profit sharing expense and stock-based compensation program expense exceeds $10 million. Continental’s profit
sharing plan creates an award pool of 15% of annual pre-tax income excluding special, unusual or non-recurring
items.
NOTE 10—SEGMENT INFORMATION
Operating segments are defined as components of an enterprise with separate financial information, which
are evaluated regularly by the chief operating decision maker and are used in resource allocation and
performance assessments. Prior to the Merger, the Company managed its business by two reporting segments:
Mainline and Regional. In connection with the Merger integration and design of the new organization, the new
management determined that the Company will be managed as one segment, airline operations, because the
Company’s services are passenger and cargo air transportation. The Company has retrospectively applied its new
segment reporting.
Managing the Company as one segment allows management the opportunity to maximize the value of its
route network. The Company has multiple aircraft fleets that are deployed across its route network through a
single route scheduling system to maximize the value of UAL. When making resource allocation decisions, the
Company’s chief operating decision maker evaluates flight profitability data, which considers aircraft type and
route economics, but gives no weight to the financial impact of the resource allocation decision on an individual
carrier basis. The Company’s chief operating decision maker makes resource allocation decisions to maximize
the Company’s consolidated financial results.
129