United Airlines 2010 Annual Report Download - page 54
Download and view the complete annual report
Please find page 54 of the 2010 United Airlines annual report below. You can navigate through the pages in the report by either clicking on the pages listed below, or by using the keyword search tool below to find specific information within the annual report.-
 1
1 -
2
-
3
-
4
-
5
-
6
-
7
-
8
-
9
-
10
-
11
-
12
-
13
-
14
-
15
-
16
-
17
-
18
-
19
-
20
-
21
-
22
-
23
-
24
-
25
-
26
-
27
-
28
-
29
-
30
-
31
-
32
-
33
-
34
-
35
-
36
-
37
-
38
-
39
-
40
-
41
-
42
-
43
-
 44
44 -
 45
45 -
 46
46 -
 47
47 -
 48
48 -
 49
49 -
 50
50 -
 51
51 -
 52
52 -
 53
53 -
 54
54 -
 55
55 -
 56
56 -
 57
57 -
 58
58 -
 59
59 -
 60
60 -
 61
61 -
 62
62 -
 63
63 -
 64
64 -
65
-
66
-
67
-
68
-
69
-
70
-
71
-
72
-
73
-
74
-
75
-
76
-
77
-
78
-
79
-
80
-
81
-
82
-
83
-
84
-
85
-
86
-
87
-
88
-
89
-
90
-
91
-
92
-
93
-
94
-
95
-
96
-
97
-
98
-
99
-
100
-
101
-
102
-
103
-
104
-
105
-
106
-
107
-
108
-
109
-
110
-
111
-
112
-
113
-
114
-
115
-
116
-
117
-
118
-
119
-
120
-
121
-
122
-
123
-
124
-
125
-
126
-
127
-
128
-
129
-
130
-
131
-
132
-
133
-
134
-
135
-
136
-
137
-
138
-
139
-
140
-
141
-
142
-
143
-
144
-
145
-
146
-
147
-
148
-
149
-
150
-
151
-
152
-
153
-
154
-
155
-
156
-
157
-
158
-
159
-
160
-
161
-
162
-
163
-
164
-
165
-
166
-
167
-
168
-
169
-
170
-
171
-
172
-
173
-
174
-
175
-
176
-
177
-
178
-
179
-
180
-
181
-
182
-
183
-
184
-
185
-
186
-
187
-
188
-
189
-
190
-
191
-
192
-
193
-
194
-
195
-
196
-
197
-
198
-
199
-
200
-
201
-
202
-
203
-
204
-
205
-
206
-
207
-
208
-
209
-
210
-
211
-
212
-
213
-
214
-
215
-
216
-
217
-
218
-
219
-
220
-
221
-
222
-
223
-
224
 |
 |

2008. The Company’s fuel derivative gain in 2009 was less significant compared to 2008 because the Company
did not have any significant derivative activity for hedges that are classified in miscellaneous, net, in 2009, other
than settlement of contracts that existed at December 31, 2008, and there was less fuel price volatility in 2009 as
compared to 2008. See Note 13 to the financial statements in Item 8 for further information related to fuel
hedges.
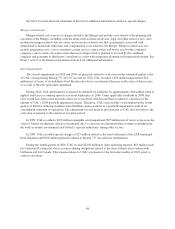
Income Taxes.
In 2010, UAL recorded a tax benefit of $11 million related to the impairment of its Brazil routes, offset by
$12 million of state and other income tax expense. The tax benefits recorded in 2009 and 2008 are related to the
impairment and sale of certain indefinite-lived intangible assets, partially offset by the impact of an increase in
state tax rates. Excluding these items, the effective tax rates differed from the federal statutory rate of 35%
primarily due to the following: change in valuation allowance, expenses that are not deductible for federal
income tax purposes and state income taxes. UAL is required to provide a valuation allowance for its deferred tax
assets in excess of deferred tax liabilities because management has concluded that it is more likely than not that
such deferred tax assets ultimately will not be realized. See Note 8 to the financial statements in Item 8 for
additional information.
United and Continental—Results of Operations—2010 Compared to 2009
During the fourth quarter of 2010, United and Continental changed their classification of certain revenue
and expense items. Historical amounts have been reclassified for comparability. See Note 1 to the financial
statements in Item 8 for additional information related to these reclassifications.
United’s and Continental’s Management’s Discussion and Analysis of Financial Condition and Results of
Operations have been abbreviated pursuant to General Instruction I(2)(a) of Form 10-K.
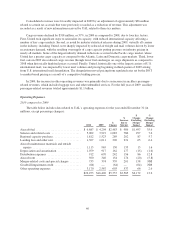
United
The following table presents information related to United’s results of operations (in millions, except
percentage changes):
2010 2009
%
Change
Operating Revenue:
Passenger revenue .................................................... $17,130 $14,197 20.7
Cargo and other revenue ............................................... 2,552 2,162 18.0
Total revenue ................................................... $19,682 $16,359 20.3
Operating Expenses:
Aircraft fuel ........................................................ $ 5,700 $ 4,204 35.6
Salaries and related costs .............................................. 4,212 3,919 7.5
Regional capacity purchase ............................................ 1,610 1,523 5.7
Landing fees and other rent ............................................ 1,077 1,011 6.5
Aircraft maintenance materials and outside repairs .......................... 980 965 1.6
Depreciation and amortization .......................................... 903 917 (1.5)
Distribution expenses ................................................. 756 670 12.8
Aircraft rent ........................................................ 326 349 (6.6)
Merger-related costs and special charges .................................. 532 374 NM
Goodwill impairment credit ............................................ (64) — NM
Other operating expenses .............................................. 2,632 2,564 2.7
Total operating expenses .......................................... $18,664 $16,496 13.1
Operating income (loss) ............................................... $ 1,018 $ (137) NM
Nonoperating expense ................................................ $ 634 $ 511 24.1
52