United Airlines 2010 Annual Report Download - page 139
Download and view the complete annual report
Please find page 139 of the 2010 United Airlines annual report below. You can navigate through the pages in the report by either clicking on the pages listed below, or by using the keyword search tool below to find specific information within the annual report.-
 1
1 -
2
-
3
-
4
-
5
-
6
-
7
-
8
-
9
-
10
-
11
-
12
-
13
-
14
-
15
-
16
-
17
-
18
-
19
-
20
-
21
-
22
-
23
-
24
-
25
-
26
-
27
-
28
-
29
-
30
-
31
-
32
-
33
-
34
-
35
-
36
-
37
-
38
-
39
-
40
-
41
-
42
-
43
-
44
-
45
-
46
-
47
-
48
-
49
-
50
-
51
-
52
-
53
-
54
-
55
-
56
-
57
-
58
-
59
-
60
-
61
-
62
-
63
-
64
-
65
-
66
-
67
-
68
-
69
-
70
-
71
-
72
-
73
-
74
-
75
-
76
-
77
-
78
-
79
-
80
-
81
-
82
-
83
-
84
-
85
-
86
-
87
-
88
-
89
-
90
-
91
-
92
-
93
-
94
-
95
-
96
-
97
-
98
-
99
-
100
-
101
-
102
-
103
-
104
-
105
-
106
-
107
-
108
-
109
-
110
-
111
-
112
-
113
-
114
-
115
-
116
-
117
-
118
-
119
-
120
-
121
-
122
-
123
-
124
-
125
-
126
-
127
-
128
-
 129
129 -
 130
130 -
 131
131 -
 132
132 -
 133
133 -
 134
134 -
 135
135 -
 136
136 -
 137
137 -
 138
138 -
 139
139 -
 140
140 -
 141
141 -
 142
142 -
 143
143 -
 144
144 -
 145
145 -
 146
146 -
 147
147 -
 148
148 -
 149
149 -
150
-
151
-
152
-
153
-
154
-
155
-
156
-
157
-
158
-
159
-
160
-
161
-
162
-
163
-
164
-
165
-
166
-
167
-
168
-
169
-
170
-
171
-
172
-
173
-
174
-
175
-
176
-
177
-
178
-
179
-
180
-
181
-
182
-
183
-
184
-
185
-
186
-
187
-
188
-
189
-
190
-
191
-
192
-
193
-
194
-
195
-
196
-
197
-
198
-
199
-
200
-
201
-
202
-
203
-
204
-
205
-
206
-
207
-
208
-
209
-
210
-
211
-
212
-
213
-
214
-
215
-
216
-
217
-
218
-
219
-
220
-
221
-
222
-
223
-
224
 |
 |

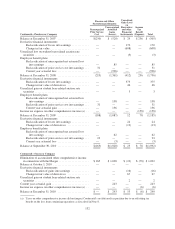
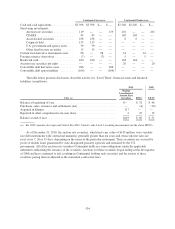
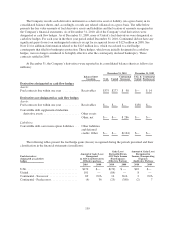
Nonrecurring Fair Value Measurements
The table below presents fair value measurements of nonfinancial assets that were performed during the years
ended December 31 (in millions):
2010 2009
Fair Value Loss Fair Value Loss
UAL
Nonoperating aircraft and spare engines .................................... $128 $120 $310 $ 93
Routes .............................................................. 124 29 — —
Tradename ........................................................... — — 420 150
United
Nonoperating aircraft and spare engines .................................... $128 $120 $310 $ 93
Routes .............................................................. 124 29 — —
Tradename ........................................................... — — 420 150
Continental—Predecessor
Nonoperating aircraft .................................................. $— $— $172 $ 31
The Company utilized the market approach to estimate the fair value of its aircraft. In 2010, the estimated
fair value of the routes was determined using an income approach. In 2009, the Company estimated the fair value
of its tradename using a discounted cash flow model. The key inputs to the discounted cash flow model were the
Company’s historical and estimated future revenues, an assumed royalty rate and discount rate among others.
While certain of these inputs are observable, significant judgment was required to select certain inputs from
observable and unobservable market data. The decrease in fair value of the tradename was due to lower estimated
revenues resulting from the weak economic environment and the Company’s capacity reductions, among other
factors. See Note 21 for additional information related to these asset impairments.
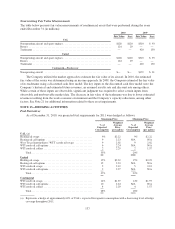
NOTE 13—HEDGING ACTIVITIES
Fuel Derivatives
As of December 31, 2010, our projected fuel requirements for 2011 were hedged as follows:
Maximum Price Minimum Price
%of
Expected
Consumption
Weighted
Average
Price
(per gallon)
%of
Expected
Consumption
Weighted
Average
Price
(per gallon)
UAL (a)
Heating oil swaps ....................................... 9% $2.22 9% $2.22
Heating oil call options ................................... 9 2.23 N/A N/A
West Texas Intermediate (“WTI”) crude oil swaps ............. 9 2.02 9 2.02
WTI crude oil call options ................................. 6 2.24 N/A N/A
WTI crude oil collars ..................................... 2 2.29 2 1.57
Total .............................................. 35% 20%
United
Heating oil swaps ....................................... 15% $2.22 15% $2.22
Heating oil call options ................................... 15 2.23 N/A N/A
WTI crude oil swaps ..................................... 5 2.12 5 2.12
WTI crude oil call options ................................. 2 2.27 N/A N/A
Total .............................................. 37% 20%
Continental
WTI crude oil swaps ..................................... 14% $1.97 14% $1.97
WTI crude oil call options ................................. 10 2.24 N/A N/A
WTI crude oil collars ..................................... 4 2.29 4 1.57
Total .............................................. 28% 18%
(a) Represents a hedge of approximately 60% of UAL’s expected first quarter consumption with a decreasing level of hedge
coverage throughout 2011.
137