United Airlines 2010 Annual Report Download - page 68
Download and view the complete annual report
Please find page 68 of the 2010 United Airlines annual report below. You can navigate through the pages in the report by either clicking on the pages listed below, or by using the keyword search tool below to find specific information within the annual report.-
 1
1 -
2
-
3
-
4
-
5
-
6
-
7
-
8
-
9
-
10
-
11
-
12
-
13
-
14
-
15
-
16
-
17
-
18
-
19
-
20
-
21
-
22
-
23
-
24
-
25
-
26
-
27
-
28
-
29
-
30
-
31
-
32
-
33
-
34
-
35
-
36
-
37
-
38
-
39
-
40
-
41
-
42
-
43
-
44
-
45
-
46
-
47
-
48
-
49
-
50
-
51
-
52
-
53
-
54
-
55
-
56
-
57
-
 58
58 -
 59
59 -
 60
60 -
 61
61 -
 62
62 -
 63
63 -
 64
64 -
 65
65 -
 66
66 -
 67
67 -
 68
68 -
 69
69 -
 70
70 -
 71
71 -
 72
72 -
 73
73 -
 74
74 -
 75
75 -
 76
76 -
 77
77 -
 78
78 -
79
-
80
-
81
-
82
-
83
-
84
-
85
-
86
-
87
-
88
-
89
-
90
-
91
-
92
-
93
-
94
-
95
-
96
-
97
-
98
-
99
-
100
-
101
-
102
-
103
-
104
-
105
-
106
-
107
-
108
-
109
-
110
-
111
-
112
-
113
-
114
-
115
-
116
-
117
-
118
-
119
-
120
-
121
-
122
-
123
-
124
-
125
-
126
-
127
-
128
-
129
-
130
-
131
-
132
-
133
-
134
-
135
-
136
-
137
-
138
-
139
-
140
-
141
-
142
-
143
-
144
-
145
-
146
-
147
-
148
-
149
-
150
-
151
-
152
-
153
-
154
-
155
-
156
-
157
-
158
-
159
-
160
-
161
-
162
-
163
-
164
-
165
-
166
-
167
-
168
-
169
-
170
-
171
-
172
-
173
-
174
-
175
-
176
-
177
-
178
-
179
-
180
-
181
-
182
-
183
-
184
-
185
-
186
-
187
-
188
-
189
-
190
-
191
-
192
-
193
-
194
-
195
-
196
-
197
-
198
-
199
-
200
-
201
-
202
-
203
-
204
-
205
-
206
-
207
-
208
-
209
-
210
-
211
-
212
-
213
-
214
-
215
-
216
-
217
-
218
-
219
-
220
-
221
-
222
-
223
-
224
 |
 |

During the first quarter of 2010, United obtained additional historical data, previously unavailable, which
enabled it to refine its estimate of the amount of breakage in its population of miles. This new data enables
United to identify historical differences between certain of its breakage estimates and the amounts that have
actually been experienced more accurately. As a result, United increased its estimate of the number of miles
expected to expire. In conjunction with this change in estimate, United also adopted a change to the accounting
methodology used to recognize breakage. Both the change in estimate and methodology have been applied
prospectively effective January 1, 2010. The new accounting method recognizes breakage as a component of the
weighted average redemption rate on actual redemptions as compared to United’s prior method which recognized
a pool of breakage dollars over an estimated redemption period. United believes that this is a preferable change
to the accounting methodology for breakage because breakage will be recognized as a component of the rate at
which actual miles are redeemed.
UAL and United estimate these changes increased passenger revenue by approximately $250 million, or
$1.21 per UAL basic share ($0.99 per UAL diluted share), in the year ended December 31, 2010.
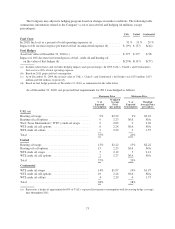
The following table summarizes information related to the Company’s frequent flyer deferred revenue:
UAL United Continental
Frequent flyer deferred revenue at December 31, 2010 (in millions) ............ $6,073 $4,024 $2,049
% of miles earned expected to expire or go unredeemed ..................... 24% 24% 25%
Impact of 1% change in outstanding miles or weighted average ticket value on
deferred revenue (in millions) ........................................ $ 63 $ 44 $ 19
Asset Impairments. During 2010, 2009 and 2008, UAL performed interim and annual impairment tests of
its intangible assets, including goodwill and certain of its long-lived assets, principally aircraft and related spare
engines and spare parts. UAL tested its indefinite lived intangible assets, including goodwill, on an annual basis.
In addition, UAL performed additional tests due to events and changes in circumstances that indicated an
impairment might have occurred. Certain factors deemed by management to have constituted a potential
impairment triggering event were a significant decline in actual and forecasted revenues, the planned removal
from UAL’s fleet of 100 aircraft, and a significant decrease in the fair value of UAL’s outstanding equity and
debt securities, including a decline in UAL’s market capitalization to significantly below book value, among
others.
UAL recorded impairment charges of $165 million, $243 million and $2.6 billion during the years ended
December 31, 2010, 2009 and 2008, respectively. The impairment charge in 2008 included a $2.3 billion
goodwill impairment.
Discussed below is the methodology used for each type of asset impairment:
Aircraft Asset Impairments
All of UAL’s aircraft impairments during 2010, 2009 and 2008 were due to aircraft that were grounded or
planned to be grounded or aircraft that were not operated by UAL. The aircraft impairments primarily related to
United’s Boeing 737 fleet, which it completely removed from service, and five of its Boeing 747 aircraft, which
it removed from service as part of United’s capacity reduction plans, which were initiated in 2008. Fair value was
estimated using the market approach. Asset appraisals, published aircraft pricing guides and recent transactions
for similar aircraft were considered by United in its market value determination. Several impairments of the
Boeing 737 and 747 aircraft occurred from 2008 to 2010 due to the weak economy and reduced demand for these
particular aircraft, among other factors.
In addition to the Boeing 737 and 747 aircraft, in 2009, UAL tested five of its owned regional jets, which
were leased to a third party, for impairment due to a weak market for these aircraft and a remaining lease term of
approximately one year. As a result of this testing, UAL recorded impairment charges of $19 million to record
the regional aircraft at estimated fair value as of December 31, 2009.
Due to the unfavorable economic and industry factors described above, UAL also determined in 2008 that it
was required to perform an impairment test of its $105 million of pre-delivery aircraft deposits and related
66