United Airlines 2010 Annual Report Download - page 43
Download and view the complete annual report
Please find page 43 of the 2010 United Airlines annual report below. You can navigate through the pages in the report by either clicking on the pages listed below, or by using the keyword search tool below to find specific information within the annual report.-
 1
1 -
2
-
3
-
4
-
5
-
6
-
7
-
8
-
9
-
10
-
11
-
12
-
13
-
14
-
15
-
16
-
17
-
18
-
19
-
20
-
21
-
22
-
23
-
24
-
25
-
26
-
27
-
28
-
29
-
30
-
31
-
32
-
 33
33 -
 34
34 -
 35
35 -
 36
36 -
 37
37 -
 38
38 -
 39
39 -
 40
40 -
 41
41 -
 42
42 -
 43
43 -
 44
44 -
 45
45 -
 46
46 -
 47
47 -
 48
48 -
 49
49 -
 50
50 -
 51
51 -
 52
52 -
 53
53 -
54
-
55
-
56
-
57
-
58
-
59
-
60
-
61
-
62
-
63
-
64
-
65
-
66
-
67
-
68
-
69
-
70
-
71
-
72
-
73
-
74
-
75
-
76
-
77
-
78
-
79
-
80
-
81
-
82
-
83
-
84
-
85
-
86
-
87
-
88
-
89
-
90
-
91
-
92
-
93
-
94
-
95
-
96
-
97
-
98
-
99
-
100
-
101
-
102
-
103
-
104
-
105
-
106
-
107
-
108
-
109
-
110
-
111
-
112
-
113
-
114
-
115
-
116
-
117
-
118
-
119
-
120
-
121
-
122
-
123
-
124
-
125
-
126
-
127
-
128
-
129
-
130
-
131
-
132
-
133
-
134
-
135
-
136
-
137
-
138
-
139
-
140
-
141
-
142
-
143
-
144
-
145
-
146
-
147
-
148
-
149
-
150
-
151
-
152
-
153
-
154
-
155
-
156
-
157
-
158
-
159
-
160
-
161
-
162
-
163
-
164
-
165
-
166
-
167
-
168
-
169
-
170
-
171
-
172
-
173
-
174
-
175
-
176
-
177
-
178
-
179
-
180
-
181
-
182
-
183
-
184
-
185
-
186
-
187
-
188
-
189
-
190
-
191
-
192
-
193
-
194
-
195
-
196
-
197
-
198
-
199
-
200
-
201
-
202
-
203
-
204
-
205
-
206
-
207
-
208
-
209
-
210
-
211
-
212
-
213
-
214
-
215
-
216
-
217
-
218
-
219
-
220
-
221
-
222
-
223
-
224
 |
 |

ITEM 7. MANAGEMENT’S DISCUSSION AND ANALYSIS OF FINANCIAL CONDITION AND
RESULTS OF OPERATIONS.
Overview
United Continental Holdings, Inc. (together with its consolidated subsidiaries, “UAL”) is a holding
company and its principal, wholly-owned subsidiaries are United Air Lines, Inc. (together with its consolidated
subsidiaries, “United”) and, effective October 1, 2010, Continental Airlines, Inc. (together with its consolidated
subsidiaries, “Continental”). Upon closing of the Merger UAL Corporation changed its name to United
Continental Holdings, Inc. We sometimes use the words “we,” “our,” “us,” and the “Company” in this Form
10-K for disclosures that relate to all of UAL, United and Continental.
This Annual Report on Form 10-K is a combined report of UAL, United, and Continental including their
respective consolidated financial statements. As UAL consolidates United and Continental for financial
statement purposes, disclosures that relate to United activities also apply to UAL and disclosures that relate to
Continental activities after the Merger closing date also apply to UAL, unless otherwise noted. When
appropriate, UAL, United and Continental are named specifically for their related activities and disclosures.
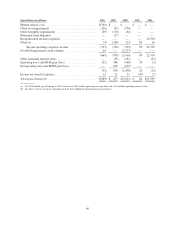
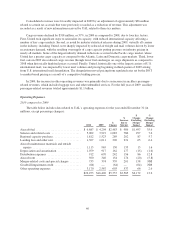
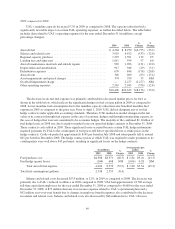
2010 Financial Highlights
• UAL recorded net income of $253 million for the year ended December 31, 2010, as compared to a net
loss of $651 million for the year ended December 31, 2009. UAL’s financial performance improved
significantly in 2010 primarily as a result of an improvement in global economic conditions following
the severe recession in 2008 and 2009. Excluding special items, UAL recorded net income of $942
million for the year ended December 31, 2010, compared to a net loss of $1.1 billion for the year ended
December 31, 2009. See Item 6 for a reconciliation of GAAP to non-GAAP net income.
• UAL passenger revenue increased 43% during 2010 as compared to 2009 primarily due to higher fares
and an increase in high-yield business traffic resulting from improved economic conditions in 2010 and
the impact of Continental passenger revenue after the closing date of the Merger.
• UAL’s unrestricted cash, cash equivalents and short-term investments balance at December 31, 2010
was a record $8.7 billion as compared to $3.0 billion at December 31, 2009. This increase in UAL’s
cash, cash equivalents and short term investments balance was primarily due to $4.2 billion of
Continental’s cash, cash equivalents and short-term investments acquired in connection with the
Merger and $1.9 billion of cash from operating activities.
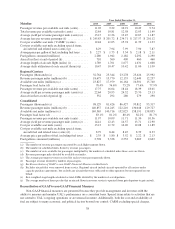
2010 Operational Highlights
• For the year ended December 31, 2010, United and Continental achieved solid results in DOT on-time
arrival and completion factor, as summarized in the following table:
2010
United Continental
On-time arrival .................................................... 85.2% 81.4%
Completion factor ................................................. 98.5% 99.0%
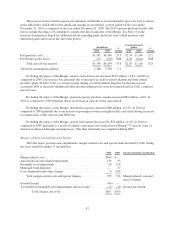
• Including Continental’s fourth quarter results, consolidated ASMs for 2010 were up 20.5% while
consolidated revenue passenger miles (“RPMs”) increased 23.3%, resulting in a consolidated load
factor of 83.1%, as compared to 81.2% in 2009.
• Continental took delivery of 14 new fuel-efficient Boeing aircraft during 2010. In addition, both United
and Continental continue to improve their premium cabins, upgrading 109 aircraft with lie-flat seats
and improving in-flight entertainment technology.
41