United Airlines 2010 Annual Report Download - page 48
Download and view the complete annual report
Please find page 48 of the 2010 United Airlines annual report below. You can navigate through the pages in the report by either clicking on the pages listed below, or by using the keyword search tool below to find specific information within the annual report.-
 1
1 -
2
-
3
-
4
-
5
-
6
-
7
-
8
-
9
-
10
-
11
-
12
-
13
-
14
-
15
-
16
-
17
-
18
-
19
-
20
-
21
-
22
-
23
-
24
-
25
-
26
-
27
-
28
-
29
-
30
-
31
-
32
-
33
-
34
-
35
-
36
-
37
-
 38
38 -
 39
39 -
 40
40 -
 41
41 -
 42
42 -
 43
43 -
 44
44 -
 45
45 -
 46
46 -
 47
47 -
 48
48 -
 49
49 -
 50
50 -
 51
51 -
 52
52 -
 53
53 -
 54
54 -
 55
55 -
 56
56 -
 57
57 -
 58
58 -
59
-
60
-
61
-
62
-
63
-
64
-
65
-
66
-
67
-
68
-
69
-
70
-
71
-
72
-
73
-
74
-
75
-
76
-
77
-
78
-
79
-
80
-
81
-
82
-
83
-
84
-
85
-
86
-
87
-
88
-
89
-
90
-
91
-
92
-
93
-
94
-
95
-
96
-
97
-
98
-
99
-
100
-
101
-
102
-
103
-
104
-
105
-
106
-
107
-
108
-
109
-
110
-
111
-
112
-
113
-
114
-
115
-
116
-
117
-
118
-
119
-
120
-
121
-
122
-
123
-
124
-
125
-
126
-
127
-
128
-
129
-
130
-
131
-
132
-
133
-
134
-
135
-
136
-
137
-
138
-
139
-
140
-
141
-
142
-
143
-
144
-
145
-
146
-
147
-
148
-
149
-
150
-
151
-
152
-
153
-
154
-
155
-
156
-
157
-
158
-
159
-
160
-
161
-
162
-
163
-
164
-
165
-
166
-
167
-
168
-
169
-
170
-
171
-
172
-
173
-
174
-
175
-
176
-
177
-
178
-
179
-
180
-
181
-
182
-
183
-
184
-
185
-
186
-
187
-
188
-
189
-
190
-
191
-
192
-
193
-
194
-
195
-
196
-
197
-
198
-
199
-
200
-
201
-
202
-
203
-
204
-
205
-
206
-
207
-
208
-
209
-
210
-
211
-
212
-
213
-
214
-
215
-
216
-
217
-
218
-
219
-
220
-
221
-
222
-
223
-
224
 |
 |

Consolidated revenues were favorably impacted in 2009 by an adjustment of approximately $36 million
related to certain tax accruals that were previously recorded as a reduction of revenue. This adjustment was
recorded as a result of new information received by UAL related to these tax matters.
Cargo revenue declined by $318 million, or 37%, in 2009 as compared to 2008, due to four key factors.
First, United took significant steps to rationalize its capacity, with reduced international capacity affecting a
number of key cargo markets. Second, as noted by industry statistical releases during 2009, virtually all carriers
in the industry, including United, were sharply impacted by reduced air freight and mail volumes driven by lower
recessionary demand, with the resulting oversupply of cargo capacity putting pressure on industry pricing in
nearly all markets. Some of the largest industry demand reductions occurred in the Pacific cargo market, where
United has a greater cargo capacity as compared to the Atlantic, Latin and Domestic cargo markets. Third, lower
fuel costs in 2009 also reduced cargo revenue through lower fuel surcharges on cargo shipments as compared to
2008 when historically high fuel prices occurred. Finally, United, historically one of the largest carriers of U.S.
international mail, was impacted by lower mail volumes and pricing beginning in third quarter of 2009 arising
from U.S. international mail deregulation. The deregulation moved pricing from regulated rates set by the DOT
to market-based pricing as a result of a competitive bidding process.
In 2009, the increase in other operating revenues was primarily due to an increase in ancillary passenger-
related revenues, which includes baggage fees and other unbundled services. For the full year of 2009, ancillary
passenger-related revenues totaled approximately $1.1 billion.
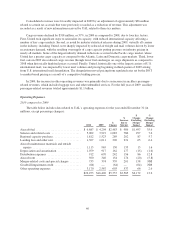
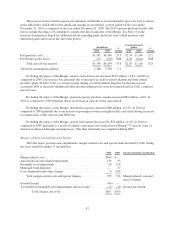
Operating Expenses.
2010 compared to 2009
The table below includes data related to UAL’s operating expenses for the year ended December 31 (in
millions, except percentage changes):
2010 2009
$
Change
$
Increase
due to
Merger
$
Change
Excluding
Merger
Impact
%
Change
Excluding
Merger
Impact
Aircraft fuel ............................... $ 6,687 $ 4,204 $2,483 $ 986 $1,497 35.6
Salaries and related costs .................... 5,002 3,919 1,083 786 297 7.6
Regional capacity purchase ................... 1,812 1,523 289 202 87 5.7
Landing fees and other rent ................... 1,307 1,011 296 231 65 6.4
Aircraft maintenance materials and outside
repairs ................................. 1,115 965 150 135 15 1.6
Depreciation and amortization ................ 1,079 917 162 177 (15) (1.6)
Distribution expenses ....................... 912 670 242 156 86 12.8
Aircraft rent ............................... 500 346 154 174 (20) (5.8)
Merger-related costs and special charges ........ 733 374 359 201 158 NM
Goodwill impairment credit .................. (64) — (64) — (64) NM
Other operating expenses .................... 3,170 2,567 603 537 66 2.6
$22,253 $16,496 $5,757 $3,585 $2,172 13.2
46