United Airlines 2010 Annual Report Download - page 38
Download and view the complete annual report
Please find page 38 of the 2010 United Airlines annual report below. You can navigate through the pages in the report by either clicking on the pages listed below, or by using the keyword search tool below to find specific information within the annual report.-
 1
1 -
2
-
3
-
4
-
5
-
6
-
7
-
8
-
9
-
10
-
11
-
12
-
13
-
14
-
15
-
16
-
17
-
18
-
19
-
20
-
21
-
22
-
23
-
24
-
25
-
26
-
27
-
 28
28 -
 29
29 -
 30
30 -
 31
31 -
 32
32 -
 33
33 -
 34
34 -
 35
35 -
 36
36 -
 37
37 -
 38
38 -
 39
39 -
 40
40 -
 41
41 -
 42
42 -
 43
43 -
 44
44 -
 45
45 -
 46
46 -
 47
47 -
 48
48 -
49
-
50
-
51
-
52
-
53
-
54
-
55
-
56
-
57
-
58
-
59
-
60
-
61
-
62
-
63
-
64
-
65
-
66
-
67
-
68
-
69
-
70
-
71
-
72
-
73
-
74
-
75
-
76
-
77
-
78
-
79
-
80
-
81
-
82
-
83
-
84
-
85
-
86
-
87
-
88
-
89
-
90
-
91
-
92
-
93
-
94
-
95
-
96
-
97
-
98
-
99
-
100
-
101
-
102
-
103
-
104
-
105
-
106
-
107
-
108
-
109
-
110
-
111
-
112
-
113
-
114
-
115
-
116
-
117
-
118
-
119
-
120
-
121
-
122
-
123
-
124
-
125
-
126
-
127
-
128
-
129
-
130
-
131
-
132
-
133
-
134
-
135
-
136
-
137
-
138
-
139
-
140
-
141
-
142
-
143
-
144
-
145
-
146
-
147
-
148
-
149
-
150
-
151
-
152
-
153
-
154
-
155
-
156
-
157
-
158
-
159
-
160
-
161
-
162
-
163
-
164
-
165
-
166
-
167
-
168
-
169
-
170
-
171
-
172
-
173
-
174
-
175
-
176
-
177
-
178
-
179
-
180
-
181
-
182
-
183
-
184
-
185
-
186
-
187
-
188
-
189
-
190
-
191
-
192
-
193
-
194
-
195
-
196
-
197
-
198
-
199
-
200
-
201
-
202
-
203
-
204
-
205
-
206
-
207
-
208
-
209
-
210
-
211
-
212
-
213
-
214
-
215
-
216
-
217
-
218
-
219
-
220
-
221
-
222
-
223
-
224
 |
 |
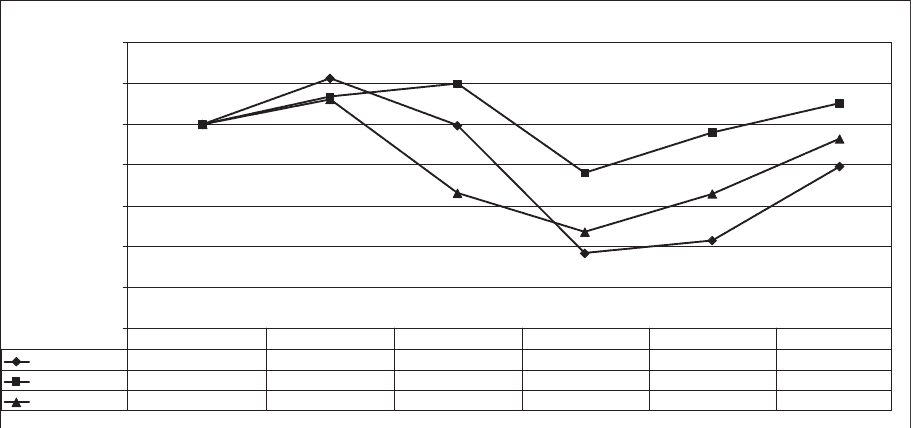
The following graph shows the cumulative total shareholder return for UAL’s common stock during the
period from February 2, 2006 (the date UAL Corporation emerged from Chapter 11 bankruptcy protection) to
December 31, 2010. The graph also shows the cumulative returns of the Standard and Poor’s (“S&P”) 500 Index
and the NYSE Arca Airline Index (“AAI”) of 13 investor-owned airlines. The comparison assumes $100 was
invested on February 2, 2006 (the date UAL common stock began trading on an exchange) in UAL common
stock and in each of the indices shown and assumes that all dividends paid were reinvested.
Performance Chart
$-
$20
$40
$60
$80
$100
$120
$140
UAL Corporation
S&P 500 Index
AAI Index
02/02/06 12/31/06 12/31/07 12/31/08 12/31/1012/31/09
122.60
113.58
112.28
99.36
119.96
66.17
36.70
76.13
47.16
42.99
95.96
65.87
79.32
110.25
92.86
100.00
100.00
100.00
Note: The stock price performance shown in the graph above should not be considered indicative of
potential future stock price performance.
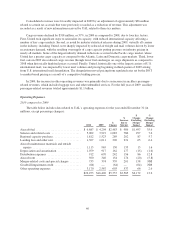
During the fourth quarter of 2010, repurchases of UAL common stock totaled 25,972 shares at an average
price of $24.65 per share. These shares were withheld from employees to satisfy certain tax obligations due upon
the vesting of restricted stock. UAL does not have an active share repurchase program.
36