United Airlines 2010 Annual Report Download - page 75
Download and view the complete annual report
Please find page 75 of the 2010 United Airlines annual report below. You can navigate through the pages in the report by either clicking on the pages listed below, or by using the keyword search tool below to find specific information within the annual report.-
 1
1 -
2
-
3
-
4
-
5
-
6
-
7
-
8
-
9
-
10
-
11
-
12
-
13
-
14
-
15
-
16
-
17
-
18
-
19
-
20
-
21
-
22
-
23
-
24
-
25
-
26
-
27
-
28
-
29
-
30
-
31
-
32
-
33
-
34
-
35
-
36
-
37
-
38
-
39
-
40
-
41
-
42
-
43
-
44
-
45
-
46
-
47
-
48
-
49
-
50
-
51
-
52
-
53
-
54
-
55
-
56
-
57
-
58
-
59
-
60
-
61
-
62
-
63
-
64
-
 65
65 -
 66
66 -
 67
67 -
 68
68 -
 69
69 -
 70
70 -
 71
71 -
 72
72 -
 73
73 -
 74
74 -
 75
75 -
 76
76 -
 77
77 -
 78
78 -
 79
79 -
 80
80 -
 81
81 -
 82
82 -
 83
83 -
 84
84 -
 85
85 -
86
-
87
-
88
-
89
-
90
-
91
-
92
-
93
-
94
-
95
-
96
-
97
-
98
-
99
-
100
-
101
-
102
-
103
-
104
-
105
-
106
-
107
-
108
-
109
-
110
-
111
-
112
-
113
-
114
-
115
-
116
-
117
-
118
-
119
-
120
-
121
-
122
-
123
-
124
-
125
-
126
-
127
-
128
-
129
-
130
-
131
-
132
-
133
-
134
-
135
-
136
-
137
-
138
-
139
-
140
-
141
-
142
-
143
-
144
-
145
-
146
-
147
-
148
-
149
-
150
-
151
-
152
-
153
-
154
-
155
-
156
-
157
-
158
-
159
-
160
-
161
-
162
-
163
-
164
-
165
-
166
-
167
-
168
-
169
-
170
-
171
-
172
-
173
-
174
-
175
-
176
-
177
-
178
-
179
-
180
-
181
-
182
-
183
-
184
-
185
-
186
-
187
-
188
-
189
-
190
-
191
-
192
-
193
-
194
-
195
-
196
-
197
-
198
-
199
-
200
-
201
-
202
-
203
-
204
-
205
-
206
-
207
-
208
-
209
-
210
-
211
-
212
-
213
-
214
-
215
-
216
-
217
-
218
-
219
-
220
-
221
-
222
-
223
-
224
 |
 |
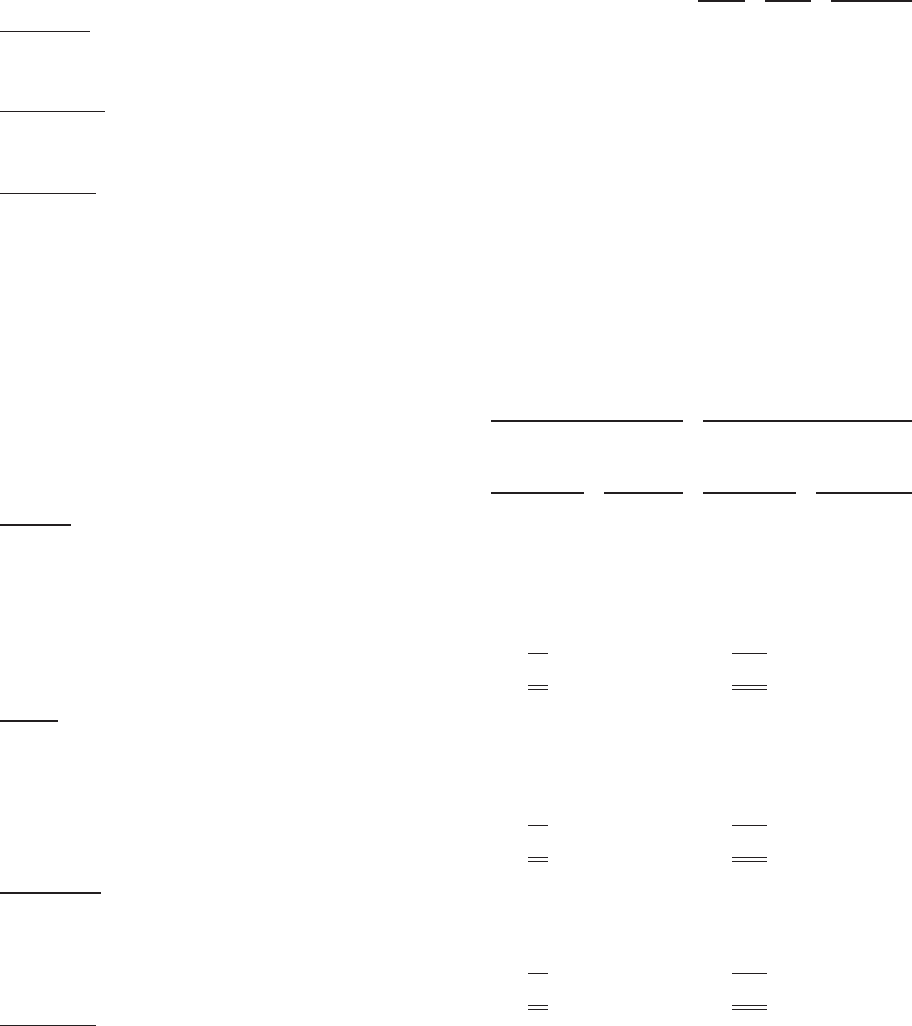
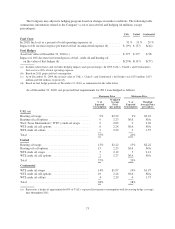
The Company may adjust its hedging program based on changes in market conditions. The following table
summarizes information related to the Company’s cost of aircraft fuel and hedging (in millions, except
percentages):
UAL United Continental
Fuel Costs
In 2010, fuel cost as a percent of total operating expenses (a) ................... 31% 31% 29%
Impact of $1 increase in price per barrel of fuel on annual fuel expense (b) ........ $ (99) $ (57) $(42)
Fuel Hedges
Asset fair value at December 31, 2010 (c) .................................. $375 $277 $98
Impact of 10% decrease in forward prices of fuel, crude oil and heating oil
on the value of fuel hedges (d) ......................................... $(274) $(197) $(77)
(a) Includes related taxes and excludes hedging impacts and special charges. In 2009, UAL’s, United’s and Continental’s
fuel cost was 26% of total operating expense.
(b) Based on 2011 projected fuel consumption.
(c) As of December 31, 2009, the net fair value of UAL’s, United’s and Continental’s fuel hedges was $133 million, $133
million and $14 million, respectively.
(d) Based on fuel hedge positions at December 31, 2010, as summarized in the table below.
As of December 31, 2010, our projected fuel requirements for 2011 were hedged as follows:
Maximum Price Minimum Price
%of
Expected
Consumption
Weighted
Average
Price
(per gallon)
%of
Expected
Consumption
Weighted
Average Price
(per gallon)
UAL (a)
Heating oil swaps ................................ 9% $2.22 9% $2.22
Heating oil call options ............................ 9 2.23 N/A N/A
West Texas Intermediate (“WTI”) crude oil swaps ...... 9 2.02 9 2.02
WTI crude oil call options ......................... 6 2.24 N/A N/A
WTI crude oil collars ............................. 2 2.29 2 1.57
Total .......................................... 35% 20%
United
Heating oil swaps ................................ 15% $2.22 15% $2.22
Heating oil call options ............................ 15 2.23 N/A N/A
WTI crude oil swaps .............................. 5 2.12 5 2.12
WTI crude oil call options ......................... 2 2.27 N/A N/A
Total .......................................... 37% 20%
Continental
WTI crude oil swaps .............................. 14% $1.97 14% $1.97
WTI crude oil call options ......................... 10 2.24 N/A N/A
WTI crude oil collars ............................. 4 2.29 4 1.57
Total .......................................... 28% 18%
(a) Represents a hedge of approximately 60% of UAL’s expected first quarter consumption with decreasing hedge coverage
later throughout 2011.
73