United Airlines 2010 Annual Report Download - page 132
Download and view the complete annual report
Please find page 132 of the 2010 United Airlines annual report below. You can navigate through the pages in the report by either clicking on the pages listed below, or by using the keyword search tool below to find specific information within the annual report.-
 1
1 -
2
-
3
-
4
-
5
-
6
-
7
-
8
-
9
-
10
-
11
-
12
-
13
-
14
-
15
-
16
-
17
-
18
-
19
-
20
-
21
-
22
-
23
-
24
-
25
-
26
-
27
-
28
-
29
-
30
-
31
-
32
-
33
-
34
-
35
-
36
-
37
-
38
-
39
-
40
-
41
-
42
-
43
-
44
-
45
-
46
-
47
-
48
-
49
-
50
-
51
-
52
-
53
-
54
-
55
-
56
-
57
-
58
-
59
-
60
-
61
-
62
-
63
-
64
-
65
-
66
-
67
-
68
-
69
-
70
-
71
-
72
-
73
-
74
-
75
-
76
-
77
-
78
-
79
-
80
-
81
-
82
-
83
-
84
-
85
-
86
-
87
-
88
-
89
-
90
-
91
-
92
-
93
-
94
-
95
-
96
-
97
-
98
-
99
-
100
-
101
-
102
-
103
-
104
-
105
-
106
-
107
-
108
-
109
-
110
-
111
-
112
-
113
-
114
-
115
-
116
-
117
-
118
-
119
-
120
-
121
-
 122
122 -
 123
123 -
 124
124 -
 125
125 -
 126
126 -
 127
127 -
 128
128 -
 129
129 -
 130
130 -
 131
131 -
 132
132 -
 133
133 -
 134
134 -
 135
135 -
 136
136 -
 137
137 -
 138
138 -
 139
139 -
 140
140 -
 141
141 -
 142
142 -
143
-
144
-
145
-
146
-
147
-
148
-
149
-
150
-
151
-
152
-
153
-
154
-
155
-
156
-
157
-
158
-
159
-
160
-
161
-
162
-
163
-
164
-
165
-
166
-
167
-
168
-
169
-
170
-
171
-
172
-
173
-
174
-
175
-
176
-
177
-
178
-
179
-
180
-
181
-
182
-
183
-
184
-
185
-
186
-
187
-
188
-
189
-
190
-
191
-
192
-
193
-
194
-
195
-
196
-
197
-
198
-
199
-
200
-
201
-
202
-
203
-
204
-
205
-
206
-
207
-
208
-
209
-
210
-
211
-
212
-
213
-
214
-
215
-
216
-
217
-
218
-
219
-
220
-
221
-
222
-
223
-
224
 |
 |

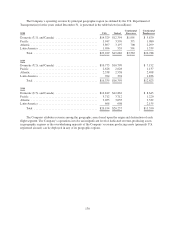
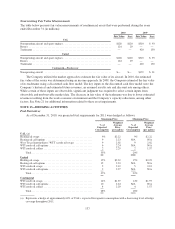
The Company’s operating revenue by principal geographic region (as defined by the U.S. Department of
Transportation) for the years ended December 31, is presented in the table below (in millions):
2010 UAL United
Continental
Successor
Continental
Predecessor
Domestic (U.S. and Canada) ............................ $14,329 $12,354 $1,991 $ 5,870
Pacific .............................................. 3,947 3,576 371 1,080
Atlantic ............................................. 3,897 3,197 700 2,299
Latin America ........................................ 1,056 555 501 1,539
Total ........................................... $23,229 $19,682 $3,563 $10,788
2009
Domestic (U.S. and Canada) ............................ $10,775 $10,799 $ 7,152
Pacific .............................................. 2,628 2,628 1,137
Atlantic ............................................. 2,538 2,538 2,498
Latin America ........................................ 394 394 1,836
Total ........................................... $16,335 $16,359 $12,623
2008
Domestic (U.S. and Canada) ............................ $12,819 $12,862 $ 8,643
Pacific .............................................. 3,712 3,712 1,220
Atlantic ............................................. 3,055 3,055 3,332
Latin America ........................................ 608 608 2,155
Total ........................................... $20,194 $20,237 $15,350
The Company attributes revenue among the geographic areas based upon the origin and destination of each
flight segment. The Company’s operations involve an insignificant level of dedicated revenue-producing assets
in geographic regions as the overwhelming majority of the Company’s revenue producing assets (primarily U.S.
registered aircraft) can be deployed in any of its geographic regions.
130