United Airlines 2010 Annual Report Download - page 137
Download and view the complete annual report
Please find page 137 of the 2010 United Airlines annual report below. You can navigate through the pages in the report by either clicking on the pages listed below, or by using the keyword search tool below to find specific information within the annual report.-
 1
1 -
2
-
3
-
4
-
5
-
6
-
7
-
8
-
9
-
10
-
11
-
12
-
13
-
14
-
15
-
16
-
17
-
18
-
19
-
20
-
21
-
22
-
23
-
24
-
25
-
26
-
27
-
28
-
29
-
30
-
31
-
32
-
33
-
34
-
35
-
36
-
37
-
38
-
39
-
40
-
41
-
42
-
43
-
44
-
45
-
46
-
47
-
48
-
49
-
50
-
51
-
52
-
53
-
54
-
55
-
56
-
57
-
58
-
59
-
60
-
61
-
62
-
63
-
64
-
65
-
66
-
67
-
68
-
69
-
70
-
71
-
72
-
73
-
74
-
75
-
76
-
77
-
78
-
79
-
80
-
81
-
82
-
83
-
84
-
85
-
86
-
87
-
88
-
89
-
90
-
91
-
92
-
93
-
94
-
95
-
96
-
97
-
98
-
99
-
100
-
101
-
102
-
103
-
104
-
105
-
106
-
107
-
108
-
109
-
110
-
111
-
112
-
113
-
114
-
115
-
116
-
117
-
118
-
119
-
120
-
121
-
122
-
123
-
124
-
125
-
126
-
 127
127 -
 128
128 -
 129
129 -
 130
130 -
 131
131 -
 132
132 -
 133
133 -
 134
134 -
 135
135 -
 136
136 -
 137
137 -
 138
138 -
 139
139 -
 140
140 -
 141
141 -
 142
142 -
 143
143 -
 144
144 -
 145
145 -
 146
146 -
 147
147 -
148
-
149
-
150
-
151
-
152
-
153
-
154
-
155
-
156
-
157
-
158
-
159
-
160
-
161
-
162
-
163
-
164
-
165
-
166
-
167
-
168
-
169
-
170
-
171
-
172
-
173
-
174
-
175
-
176
-
177
-
178
-
179
-
180
-
181
-
182
-
183
-
184
-
185
-
186
-
187
-
188
-
189
-
190
-
191
-
192
-
193
-
194
-
195
-
196
-
197
-
198
-
199
-
200
-
201
-
202
-
203
-
204
-
205
-
206
-
207
-
208
-
209
-
210
-
211
-
212
-
213
-
214
-
215
-
216
-
217
-
218
-
219
-
220
-
221
-
222
-
223
-
224
 |
 |

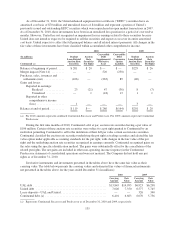
As of December 31, 2010, the United enhanced equipment trust certificate (“EETC”) securities have an
amortized cost basis of $70 million and unrealized losses of $4 million and represent a portion of United’s
previously issued and outstanding EETC securities which were repurchased in open market transactions in 2007.
As of December 31, 2010, these investments have been in an unrealized loss position for a period of over twelve
months. However, United has not recognized an impairment loss in earnings related to these securities because
United does not intend or expect to be required to sell the securities and expects to recover its entire amortized
cost basis. United expects to collect the full principal balance and all related interest payments. All changes in the
fair value of these investments have been classified within accumulated other comprehensive income.
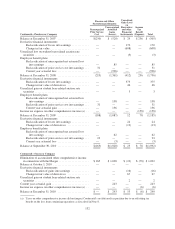
2010 2009
(In millions)
Continental (a)
Student
Loan-Related
Auction Rate
Securities
Auction
Rate
Securities
Put Right
Convertible
Debt
Supplemental
Derivative
Asset
Convertible
Debt
Conversion
Option
Liability
Student
Loan-Related
Auction Rate
Securities
Auction
Rate
Securities
Put Right
Balance at beginning of period ..... $201 $ 20 $— $— $229 $ 26
Merger impact (Note 14) ......... — — 520 (230) — —
Purchases, sales, issuances and
settlements (net) .............. (106) — (263) 89 (40) —
Gains and losses:
Reported in earnings:
Realized .............. 23 (21) 47 (36) 8 (7)
Unrealized ............ — 1 (18) 13 1 1
Reported in other
comprehensive income
(loss) ................... 1 — — — 3 —
Balance at end of period .......... $119 $— $286 $(164) $201 $ 20
(a) For 2010, amounts represent combined Continental Successor and Predecessor. For 2009, amounts represent Continental
Predecessor.
During the first nine months of 2010, Continental sold, at par, auction rate securities having a par value of
$106 million. Certain of these auction rate securities were subject to a put right granted to Continental by an
institution permitting Continental to sell to the institution at their full par value certain auction rate securities.
Continental classified the auction rate securities underlying the put right as trading securities and elected the fair
value option under applicable accounting standards for the put right, with changes in the fair value of the put
right and the underlying auction rate securities recognized in earnings currently. Continental recognized gains on
the sales using the specific identification method. The gains were substantially offset by the cancellation of the
related put rights. The net gains are included in other non-operating income (expense) in the Continental
Predecessor statement of consolidated operations and were not material. The Company did not hold any put
rights as of December 31, 2010.
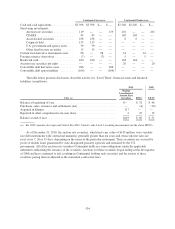
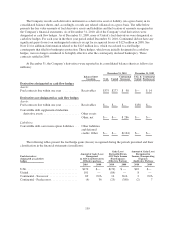
Derivative instruments and investments presented in the tables above have the same fair value as their
carrying value. The table below presents the carrying values and estimated fair values of financial instruments
not presented in the tables above for the years ended December 31 (in millions):
2010 2009
Carrying
Amount
Fair
Value
Carrying
Amount
Fair
Value
UAL debt .................................................. $13,845 $14,995 $6,923 $6,298
United debt ................................................ 7,026 7,350 6,577 5,745
Lease deposits—UAL and United ............................... — — 326 340
Continental debt (a) .......................................... 6,401 6,663 6,070 5,756
(a) Represents Continental Successor and Predecessor as of December 31, 2010 and 2009, respectively.
135