United Airlines 2010 Annual Report Download - page 39
Download and view the complete annual report
Please find page 39 of the 2010 United Airlines annual report below. You can navigate through the pages in the report by either clicking on the pages listed below, or by using the keyword search tool below to find specific information within the annual report.-
 1
1 -
2
-
3
-
4
-
5
-
6
-
7
-
8
-
9
-
10
-
11
-
12
-
13
-
14
-
15
-
16
-
17
-
18
-
19
-
20
-
21
-
22
-
23
-
24
-
25
-
26
-
27
-
28
-
 29
29 -
 30
30 -
 31
31 -
 32
32 -
 33
33 -
 34
34 -
 35
35 -
 36
36 -
 37
37 -
 38
38 -
 39
39 -
 40
40 -
 41
41 -
 42
42 -
 43
43 -
 44
44 -
 45
45 -
 46
46 -
 47
47 -
 48
48 -
 49
49 -
50
-
51
-
52
-
53
-
54
-
55
-
56
-
57
-
58
-
59
-
60
-
61
-
62
-
63
-
64
-
65
-
66
-
67
-
68
-
69
-
70
-
71
-
72
-
73
-
74
-
75
-
76
-
77
-
78
-
79
-
80
-
81
-
82
-
83
-
84
-
85
-
86
-
87
-
88
-
89
-
90
-
91
-
92
-
93
-
94
-
95
-
96
-
97
-
98
-
99
-
100
-
101
-
102
-
103
-
104
-
105
-
106
-
107
-
108
-
109
-
110
-
111
-
112
-
113
-
114
-
115
-
116
-
117
-
118
-
119
-
120
-
121
-
122
-
123
-
124
-
125
-
126
-
127
-
128
-
129
-
130
-
131
-
132
-
133
-
134
-
135
-
136
-
137
-
138
-
139
-
140
-
141
-
142
-
143
-
144
-
145
-
146
-
147
-
148
-
149
-
150
-
151
-
152
-
153
-
154
-
155
-
156
-
157
-
158
-
159
-
160
-
161
-
162
-
163
-
164
-
165
-
166
-
167
-
168
-
169
-
170
-
171
-
172
-
173
-
174
-
175
-
176
-
177
-
178
-
179
-
180
-
181
-
182
-
183
-
184
-
185
-
186
-
187
-
188
-
189
-
190
-
191
-
192
-
193
-
194
-
195
-
196
-
197
-
198
-
199
-
200
-
201
-
202
-
203
-
204
-
205
-
206
-
207
-
208
-
209
-
210
-
211
-
212
-
213
-
214
-
215
-
216
-
217
-
218
-
219
-
220
-
221
-
222
-
223
-
224
 |
 |

ITEM 6. SELECTED FINANCIAL DATA.
In connection with its emergence from Chapter 11 bankruptcy protection, UAL applied fresh-start
accounting for reorganization, effective February 1, 2006.As a result of the adoption of fresh-start accounting,
the financial statements prior to February 1, 2006 are not comparable with the financial statements after
February 1, 2006. References to “Successor Company” refer to UAL on or after February 1, 2006, after giving
effect to the adoption of fresh-start reporting. References to “Predecessor Company” refer to UAL prior to
February 1, 2006. UAL’s consolidated financial statements and statistical data provided in the tables below
include the results of Continental for the period from October 1, 2010 to December 31, 2010.
UAL Statement of Operations Data Successor Predecessor
(In millions, except per share amounts) Year Ended December 31,
2010 2009 2008 2007
Period
from
Feb. 1 to
Dec. 31,
2006
Period
from
Jan. 1 to
Jan. 31,
2006
Income Statement Data:
Operating revenues .......................... $23,229 $16,335 $20,194 $20,143 $17,882 $ 1,458
Operating expenses .......................... 22,253 16,496 24,632 19,106 17,383 1,510
Operating income (loss) ...................... 976 (161) (4,438) 1,037 499 (52)
Net income (loss) ........................... 253 (651) (5,396) 360 7 22,851
Netincome(loss)excludingspecialitems(a) .......
942 (1,128) (1,773) 298 2 (83)
Basic earnings (loss) per share ................. 1.22 (4.32) (42.59) 2.94 (0.02) 196.61
Diluted earnings (loss) per share ................ 1.08 (4.32) (42.59) 2.65 (0.02) 196.61
Cashdistributiondeclaredpercommonshare(b) ......
— — — 2.15 — —
Balance Sheet Data at period-end:
Unrestricted cash, cash equivalents and short-term
investments .............................. $ 8,680 $ 3,042 $ 2,039 $ 3,554 $ 4,144
Total assets ................................ 39,598 18,684 19,465 24,223 25,372
Debt and capital lease obligations ............... 15,133 8,543 8,004 8,255 10,364
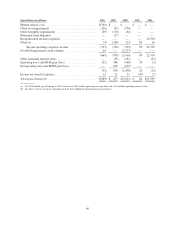
(a) See Reconciliation of GAAP to non-GAAP Financial Measures in this Item 6 for further details related to items that significantly
impacted UAL’s results.
(b) Paid in January 2008.
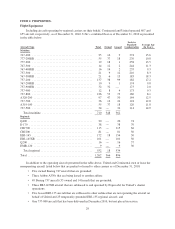
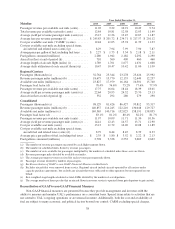
UAL Selected Operating Data
Presented below is the Company’s operating data for the years ended December 31. The 2010 operating data
includes results of Continental after the Merger.
Year Ended December 31,
Mainline 2010 2009 2008 2007 2006
Passengers (thousands) (a) ........................... 65,365 56,082 63,149 68,386 69,325
Revenue passenger miles (“RPMs”) (millions) (b) ........ 122,182 100,475 110,061 117,399 117,470
Available seat miles (“ASMs”) (millions) (c) ............ 145,738 122,737 135,861 141,890 143,095
Cargo ton miles (millions) ........................... 2,176 1,603 1,921 2,012 2,048
Passenger load factor (d)
Mainline ..................................... 83.8% 81.9% 81.0% 82.7% 82.1%
Domestic ..................................... 84.8% 83.7% 82.6% 83.2% 81.7%
International .................................. 82.7% 79.4% 79.0% 82.1% 82.7%
37