United Airlines 2010 Annual Report Download - page 105
Download and view the complete annual report
Please find page 105 of the 2010 United Airlines annual report below. You can navigate through the pages in the report by either clicking on the pages listed below, or by using the keyword search tool below to find specific information within the annual report.-
 1
1 -
2
-
3
-
4
-
5
-
6
-
7
-
8
-
9
-
10
-
11
-
12
-
13
-
14
-
15
-
16
-
17
-
18
-
19
-
20
-
21
-
22
-
23
-
24
-
25
-
26
-
27
-
28
-
29
-
30
-
31
-
32
-
33
-
34
-
35
-
36
-
37
-
38
-
39
-
40
-
41
-
42
-
43
-
44
-
45
-
46
-
47
-
48
-
49
-
50
-
51
-
52
-
53
-
54
-
55
-
56
-
57
-
58
-
59
-
60
-
61
-
62
-
63
-
64
-
65
-
66
-
67
-
68
-
69
-
70
-
71
-
72
-
73
-
74
-
75
-
76
-
77
-
78
-
79
-
80
-
81
-
82
-
83
-
84
-
85
-
86
-
87
-
88
-
89
-
90
-
91
-
92
-
93
-
94
-
 95
95 -
 96
96 -
 97
97 -
 98
98 -
 99
99 -
 100
100 -
 101
101 -
 102
102 -
 103
103 -
 104
104 -
 105
105 -
 106
106 -
 107
107 -
 108
108 -
 109
109 -
 110
110 -
 111
111 -
 112
112 -
 113
113 -
 114
114 -
 115
115 -
116
-
117
-
118
-
119
-
120
-
121
-
122
-
123
-
124
-
125
-
126
-
127
-
128
-
129
-
130
-
131
-
132
-
133
-
134
-
135
-
136
-
137
-
138
-
139
-
140
-
141
-
142
-
143
-
144
-
145
-
146
-
147
-
148
-
149
-
150
-
151
-
152
-
153
-
154
-
155
-
156
-
157
-
158
-
159
-
160
-
161
-
162
-
163
-
164
-
165
-
166
-
167
-
168
-
169
-
170
-
171
-
172
-
173
-
174
-
175
-
176
-
177
-
178
-
179
-
180
-
181
-
182
-
183
-
184
-
185
-
186
-
187
-
188
-
189
-
190
-
191
-
192
-
193
-
194
-
195
-
196
-
197
-
198
-
199
-
200
-
201
-
202
-
203
-
204
-
205
-
206
-
207
-
208
-
209
-
210
-
211
-
212
-
213
-
214
-
215
-
216
-
217
-
218
-
219
-
220
-
221
-
222
-
223
-
224
 |
 |
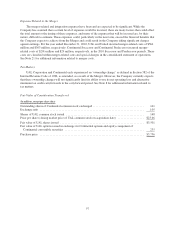
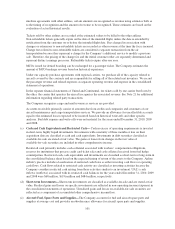
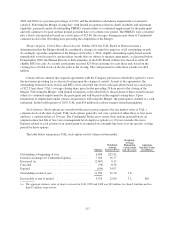
The value of miles is estimated assuming redemptions on the Company and other participating carriers in
the loyalty programs and by estimating the relative proportions of awards to be redeemed by class of service
within broad geographic regions of the Company’s operations. This estimate also includes the cost of
redemptions on other airlines, and the cost of certain other awards. The estimation of the fair value of each
award mile requires the use of several significant assumptions, for which significant management judgment
is required. For example, management must estimate how many miles are projected to be redeemed on its
airline, versus on other airlines. Since the equivalent ticket value of miles redeemed on the Company and on
other carriers can vary greatly, this assumption can materially affect the calculation of the weighted-average
ticket value from period to period.
Management uses historical customer redemption patterns as the best single indicator of future redemption
behavior in making its estimates, but changes in customer redemption behavior to patterns which are not
consistent with historical behavior may result in material changes to deferred revenue balances and to
recognized revenue.
The Company measures its deferred revenue obligation using all awarded and outstanding miles, regardless
of whether or not the customer has accumulated enough miles to redeem an award. Some of these sold and
awarded miles will never be redeemed by program members, which we refer to as “breakage.” UAL reviews
its breakage estimates annually based upon the latest available information regarding redemption and
expiration patterns. Prior to January 1, 2010, UAL and United recognized revenue related to expected
expired miles over the estimated redemption period.
Management’s estimate of the expected expiration of miles requires significant management judgment.
Current and future changes to expiration assumptions or to the expiration policy, or to program rules and
program redemption opportunities, may result in material changes to the deferred revenue balance, as well
as recognized revenues from the programs. For example, various program rule differences exist between the
United and Continental programs. One such difference is for expiration of miles, as under United’s program
miles expire after eighteen months of inactivity, whereas miles do not expire under Continental’s program.
Although Continental’s program does not cancel accounts for inactivity, Continental records breakage
revenue by estimating that a portion of the miles will never be redeemed based on statistical analysis of
sales and redemptions of miles. Continental records an estimate of breakage revenue using this data.
During the first quarter of 2010, United obtained additional historical data, previously unavailable, which
enabled it to refine its estimate of the amount of breakage in its population of miles. This new data enables
United to identify historical differences between certain of its breakage estimates and the amounts that have
actually been experienced more accurately. As a result, United increased its estimate of the number of miles
expected to expire. In conjunction with this change in estimate, United also adopted a change to the
accounting methodology used to recognize breakage. Both the change in estimate and methodology have
been applied prospectively effective January 1, 2010. The new accounting method recognizes breakage as a
component of the weighted average redemption rate on actual redemptions as compared to United’s prior
method which recognized a pool of breakage dollars over an estimated redemption period. United believes
that this is a preferable change to the accounting methodology for breakage because breakage will be
recognized as a component of the rate at which actual miles are redeemed.
UAL and United estimate these changes increased passenger revenue by approximately $250 million, or
$1.21 per UAL basic share ($0.99 per UAL diluted share), in the year ended December 31, 2010.
103