United Airlines 2010 Annual Report Download - page 152
Download and view the complete annual report
Please find page 152 of the 2010 United Airlines annual report below. You can navigate through the pages in the report by either clicking on the pages listed below, or by using the keyword search tool below to find specific information within the annual report.-
 1
1 -
2
-
3
-
4
-
5
-
6
-
7
-
8
-
9
-
10
-
11
-
12
-
13
-
14
-
15
-
16
-
17
-
18
-
19
-
20
-
21
-
22
-
23
-
24
-
25
-
26
-
27
-
28
-
29
-
30
-
31
-
32
-
33
-
34
-
35
-
36
-
37
-
38
-
39
-
40
-
41
-
42
-
43
-
44
-
45
-
46
-
47
-
48
-
49
-
50
-
51
-
52
-
53
-
54
-
55
-
56
-
57
-
58
-
59
-
60
-
61
-
62
-
63
-
64
-
65
-
66
-
67
-
68
-
69
-
70
-
71
-
72
-
73
-
74
-
75
-
76
-
77
-
78
-
79
-
80
-
81
-
82
-
83
-
84
-
85
-
86
-
87
-
88
-
89
-
90
-
91
-
92
-
93
-
94
-
95
-
96
-
97
-
98
-
99
-
100
-
101
-
102
-
103
-
104
-
105
-
106
-
107
-
108
-
109
-
110
-
111
-
112
-
113
-
114
-
115
-
116
-
117
-
118
-
119
-
120
-
121
-
122
-
123
-
124
-
125
-
126
-
127
-
128
-
129
-
130
-
131
-
132
-
133
-
134
-
135
-
136
-
137
-
138
-
139
-
140
-
141
-
 142
142 -
 143
143 -
 144
144 -
 145
145 -
 146
146 -
 147
147 -
 148
148 -
 149
149 -
 150
150 -
 151
151 -
 152
152 -
 153
153 -
 154
154 -
 155
155 -
 156
156 -
 157
157 -
 158
158 -
 159
159 -
 160
160 -
 161
161 -
 162
162 -
163
-
164
-
165
-
166
-
167
-
168
-
169
-
170
-
171
-
172
-
173
-
174
-
175
-
176
-
177
-
178
-
179
-
180
-
181
-
182
-
183
-
184
-
185
-
186
-
187
-
188
-
189
-
190
-
191
-
192
-
193
-
194
-
195
-
196
-
197
-
198
-
199
-
200
-
201
-
202
-
203
-
204
-
205
-
206
-
207
-
208
-
209
-
210
-
211
-
212
-
213
-
214
-
215
-
216
-
217
-
218
-
219
-
220
-
221
-
222
-
223
-
224
 |
 |

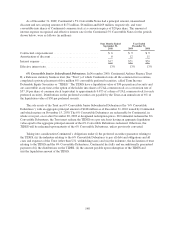
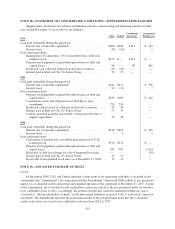
(c) As of December 31, 2010, United’s aircraft capital lease minimum payments relate to leases of 61 mainline and 38
regional aircraft and Continental’s aircraft capital lease minimum payments relate to nonaircraft assets. United’s and
Continental’s imputed interest rate ranges are 3.0% to 20.0% and 3.0% to 8.4%, respectively.
Aircraft operating leases have initial terms of one to 24 years, with expiration dates ranging from 2011
through 2024. The Company has facility operating leases that extend to 2032. Under the terms of most leases, the
Company has the right to purchase the aircraft at the end of the lease term, in some cases at fair market value,
and in others, at fair market value or a percentage of cost.
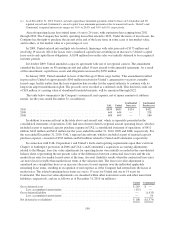
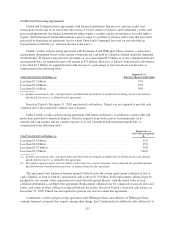
In 2009, United entered into multiple sale-leaseback financings with sales proceeds of $175 million and
involving 19 aircraft. All of the leases were considered capital leases resulting in an increase to United’s capital
lease assets and capital lease obligations. A $108 million loss on the sales was initially deferred to be recognized
in future periods.
In October 2009, United amended a capacity agreement with one of its regional carriers. The amendment
extended the lease terms on 40 existing aircraft and added 14 new aircraft to the amended agreement. As a result
of this amendment, capital lease assets and obligations increased by $250 million.
In January 2009, United amended its lease of the Chicago O’Hare cargo facility. This amendment resulted
in proceeds to United of approximately $160 million in return for United’s agreement to vacate its currently
leased cargo facility earlier than the lease expiration date in order for the airport authority to continue with its
long-term airport modernization plan. The proceeds were recorded as a deferred credit. This deferred credit, net
of $18 million of carrying value of abandoned leasehold interests, will be amortized through 2022.
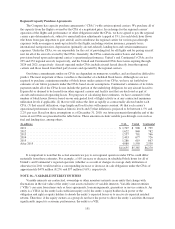
The table below summarizes the Company’s nonaircraft rent expense, net of minor amounts of sublease
rentals, for the years ended December 31, (in millions):
UAL United
Continental
Successor
Continental
Predecessor
2010 ....................................................... $839 $685 $154 $452
2009 ....................................................... 644 644 — 578
2008 ....................................................... 609 609 — 580
In addition to nonaircraft rent in the table above and aircraft rent, which is separately presented in the
consolidated statements of operations, UAL had aircraft rent related to regional aircraft operating leases, which is
included as part of regional capacity purchase expense in UAL’s consolidated statement of operations, of $411
million, $443 million and $413 million for the years ended December 31, 2010, 2009 and 2008, respectively. For
the year ended December 31, 2010, UAL’s regional aircraft rent, which is included as part of regional capacity
purchase expense, consisted of $393 million and $18 million related to United and Continental, respectively.
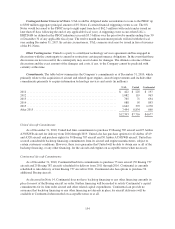
In connection with UAL Corporation’s and United’s fresh-start reporting requirements upon their exit from
Chapter 11 bankruptcy protection in 2006 and UAL’s and Continental’s acquisition accounting adjustments
related to the Merger, lease fair value adjustments for operating leases were initially recorded in the consolidated
balance sheet, representing the net present value of the differences between contractual lease rates and the fair
market lease rates for similar leased assets at the time. An asset (liability) results when the contractual lease rates
are more (less) favorable than market lease terms at the valuation date. The lease fair value adjustment is
amortized on a straight-line basis as an increase (decrease) to rent expense over the individual applicable
remaining lease terms, resulting in recognition of rent expense as if the Company had entered into the leases at
market rates. The related remaining lease terms are one to 15 years for United and one to 14 years for
Continental. The lease fair value adjustments are classified within other noncurrent assets and other noncurrent
liabilities, respectively, and are as follows as of December 31, 2010 (in millions):
United Continental
Gross deferred asset .............................................................. $263 $ —
Less: accumulated amortization ................................................ (155) —
Gross deferred liability ........................................................... — (1,433)
Less: accumulated amortization ................................................ — 59
Net deferred asset (liability) ....................................................... $108 $(1,374)
150