United Airlines 2010 Annual Report Download - page 46
Download and view the complete annual report
Please find page 46 of the 2010 United Airlines annual report below. You can navigate through the pages in the report by either clicking on the pages listed below, or by using the keyword search tool below to find specific information within the annual report.-
 1
1 -
2
-
3
-
4
-
5
-
6
-
7
-
8
-
9
-
10
-
11
-
12
-
13
-
14
-
15
-
16
-
17
-
18
-
19
-
20
-
21
-
22
-
23
-
24
-
25
-
26
-
27
-
28
-
29
-
30
-
31
-
32
-
33
-
34
-
35
-
 36
36 -
 37
37 -
 38
38 -
 39
39 -
 40
40 -
 41
41 -
 42
42 -
 43
43 -
 44
44 -
 45
45 -
 46
46 -
 47
47 -
 48
48 -
 49
49 -
 50
50 -
 51
51 -
 52
52 -
 53
53 -
 54
54 -
 55
55 -
 56
56 -
57
-
58
-
59
-
60
-
61
-
62
-
63
-
64
-
65
-
66
-
67
-
68
-
69
-
70
-
71
-
72
-
73
-
74
-
75
-
76
-
77
-
78
-
79
-
80
-
81
-
82
-
83
-
84
-
85
-
86
-
87
-
88
-
89
-
90
-
91
-
92
-
93
-
94
-
95
-
96
-
97
-
98
-
99
-
100
-
101
-
102
-
103
-
104
-
105
-
106
-
107
-
108
-
109
-
110
-
111
-
112
-
113
-
114
-
115
-
116
-
117
-
118
-
119
-
120
-
121
-
122
-
123
-
124
-
125
-
126
-
127
-
128
-
129
-
130
-
131
-
132
-
133
-
134
-
135
-
136
-
137
-
138
-
139
-
140
-
141
-
142
-
143
-
144
-
145
-
146
-
147
-
148
-
149
-
150
-
151
-
152
-
153
-
154
-
155
-
156
-
157
-
158
-
159
-
160
-
161
-
162
-
163
-
164
-
165
-
166
-
167
-
168
-
169
-
170
-
171
-
172
-
173
-
174
-
175
-
176
-
177
-
178
-
179
-
180
-
181
-
182
-
183
-
184
-
185
-
186
-
187
-
188
-
189
-
190
-
191
-
192
-
193
-
194
-
195
-
196
-
197
-
198
-
199
-
200
-
201
-
202
-
203
-
204
-
205
-
206
-
207
-
208
-
209
-
210
-
211
-
212
-
213
-
214
-
215
-
216
-
217
-
218
-
219
-
220
-
221
-
222
-
223
-
224
 |
 |

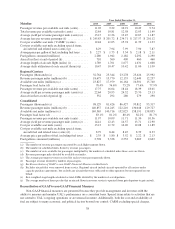
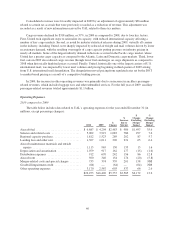
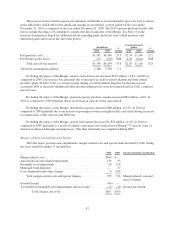
Operating Revenues.
2010 compared to 2009
The table below illustrates the year-over-year percentage change in UAL’s operating revenues for the years
ended December 31 (in millions, except percentage changes):
2010 2009
$
Change
$ Increase
due to
Merger
$ Change
Excluding
Merger
Impact
% Change
Excluding
Merger Impact
Passenger—Mainline ................... $16,069 $11,313 $4,756 $2,606 $2,150 19.0
Passenger—Regional ................... 4,229 2,884 1,345 561 784 27.2
Total passenger revenue ............ 20,298 14,197 6,101 3,167 2,934 20.7
Cargo ............................... 832 536 296 119 177 33.0
Other operating revenue ................ 2,099 1,602 497 277 220 13.7
$23,229 $16,335 $6,894 $3,563 $3,331 20.4
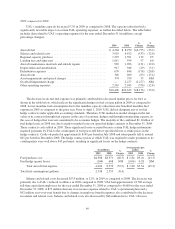
The table below presents UAL’s passenger revenues and selected operating data based on geographic region:
Increase (decrease) in 2010 from 2009 (a):
Domestic Pacific Atlantic Latin
Total
Mainline
Regional
Carriers Consolidated
Passenger revenue (in millions) ......... $603 $831 $571 $145 $2,150 $ 784 $2,934
Passenger revenue .................... 9.2% 37.2% 25.8% 42.6% 19.0% 27.2% 20.7%
Average fare per passenger ............. 15.6% 27.2% 21.1% 32.5% 23.5% 13.1% 19.0%
Yield .............................. 10.9% 26.9% 20.6% 31.7% 16.8% 6.8% 16.1%
Passenger revenue per available seat mile
(“PRASM”) ....................... 12.5% 37.7% 21.1% 36.1% 20.1% 9.5% 19.1%
Average length of aircraft flight ......... 5.8% (1.3)% (1.8)% (1.3)% 5.8% 8.5% 3.0%
Passengers .......................... (5.5)% 7.8% 3.9% 7.7% (3.7)% 12.5% 1.4%
RPMs (traffic) ....................... (1.5)% 8.0% 4.4% 8.4% 1.9% 19.0% 3.9%
ASMs (capacity) ..................... (3.0)% (0.4)% 4.0% 4.8% (0.9)% 16.1% 1.3%
Passenger load factor .................. 1.3pts. 6.6 pts. 0.3 pts. 2.7 pts. 2.2 pts. 1.9 pts. 2.1 pts.
(a) See Item 6 for the definition of these statistics.
Excluding the impact of the Merger, consolidated passenger revenue in 2010 increased approximately $2.9
billion, or 21%, as compared to 2009. These increases were due to increases of 19.0% and 16.1% in average fare
and yield, respectively, over the same period as a result of strengthening economic conditions and industry
capacity discipline. An increase in volume in 2010, as measured by passenger volume, also contributed to the
increase in revenues in 2010 as compared to 2009. The revenue improvement in 2010 was also driven by the
return of business and international premium cabin passengers whose higher ticket prices combined to increase
average fares and yields. The international regions in particular had the largest increases in demand with
international passenger revenue per ASM increasing 29.9% on a 1.8% increase in capacity. Passenger revenue in
2010 included approximately $250 million of additional revenue due to changes in the Company’s estimate and
methodology related to loyalty program accounting as noted in Critical Accounting Policies, below.
Excluding the impact of the Merger, cargo revenue increased by $177 million, or 33%, in 2010 as compared
to 2009, primarily due to improved economic conditions resulting in improved traffic and yield. UAL’s freight
ton miles improved by 22.1% in 2010 as compared to 2009, while mail ton miles dropped approximately 8.8%
during the same period, for a composite cargo traffic gain of 18.3%. Freight yields in 2010 were 15.0% better
than in 2009 due to stronger freight traffic, reduced industry capacity and numerous tactical rate recovery
initiatives, particularly in UAL’s Pacific markets. On a composite basis, cargo yield in 2010 increased 12.6% as
compared to 2009.
44