United Airlines 2010 Annual Report Download - page 45
Download and view the complete annual report
Please find page 45 of the 2010 United Airlines annual report below. You can navigate through the pages in the report by either clicking on the pages listed below, or by using the keyword search tool below to find specific information within the annual report.-
 1
1 -
2
-
3
-
4
-
5
-
6
-
7
-
8
-
9
-
10
-
11
-
12
-
13
-
14
-
15
-
16
-
17
-
18
-
19
-
20
-
21
-
22
-
23
-
24
-
25
-
26
-
27
-
28
-
29
-
30
-
31
-
32
-
33
-
34
-
 35
35 -
 36
36 -
 37
37 -
 38
38 -
 39
39 -
 40
40 -
 41
41 -
 42
42 -
 43
43 -
 44
44 -
 45
45 -
 46
46 -
 47
47 -
 48
48 -
 49
49 -
 50
50 -
 51
51 -
 52
52 -
 53
53 -
 54
54 -
 55
55 -
56
-
57
-
58
-
59
-
60
-
61
-
62
-
63
-
64
-
65
-
66
-
67
-
68
-
69
-
70
-
71
-
72
-
73
-
74
-
75
-
76
-
77
-
78
-
79
-
80
-
81
-
82
-
83
-
84
-
85
-
86
-
87
-
88
-
89
-
90
-
91
-
92
-
93
-
94
-
95
-
96
-
97
-
98
-
99
-
100
-
101
-
102
-
103
-
104
-
105
-
106
-
107
-
108
-
109
-
110
-
111
-
112
-
113
-
114
-
115
-
116
-
117
-
118
-
119
-
120
-
121
-
122
-
123
-
124
-
125
-
126
-
127
-
128
-
129
-
130
-
131
-
132
-
133
-
134
-
135
-
136
-
137
-
138
-
139
-
140
-
141
-
142
-
143
-
144
-
145
-
146
-
147
-
148
-
149
-
150
-
151
-
152
-
153
-
154
-
155
-
156
-
157
-
158
-
159
-
160
-
161
-
162
-
163
-
164
-
165
-
166
-
167
-
168
-
169
-
170
-
171
-
172
-
173
-
174
-
175
-
176
-
177
-
178
-
179
-
180
-
181
-
182
-
183
-
184
-
185
-
186
-
187
-
188
-
189
-
190
-
191
-
192
-
193
-
194
-
195
-
196
-
197
-
198
-
199
-
200
-
201
-
202
-
203
-
204
-
205
-
206
-
207
-
208
-
209
-
210
-
211
-
212
-
213
-
214
-
215
-
216
-
217
-
218
-
219
-
220
-
221
-
222
-
223
-
224
 |
 |
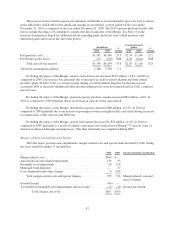
achieved in 2010. Based on projected fuel consumption in 2011, a one dollar change in the price of a barrel of
crude oil would change UAL’s annual fuel expense by approximately $100 million, assuming there are no
changes to the crude oil to aircraft fuel refining margins and no impact from our fuel hedging program. To
protect against increases in the prices of fuel, the Company routinely hedges a portion of its future fuel
requirements, provided the hedges are expected to be cost effective. See Note 13 to the financial statements in
Item 8 for additional details regarding the Company’s hedging activities.
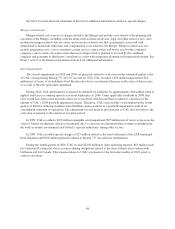
Additional Revenue-Generating and Cost Saving Measures. We intend to offer additional goods and
services relating to air travel, a portion of which will come from the “unbundling” of our current product and a
portion of which will come from future goods and services that we do not presently offer. The revenues that we
derive from these products and services, which are generally referred to as ancillary revenues, typically have
higher margins than that of our core transportation services and are an important element of our strategy to
sustain the profitability that we achieved in 2010. The “unbundling” of our current products and services permits
our customers flexibility in selecting the products and services they wish to purchase. An example of a new
service that we have introduced is Continental’s FareLock, introduced in December 2010, which is an option that
offers customers the opportunity, for a fee, to hold reservations and lock-in ticket prices for either 72 hours or
seven days with no commitment to purchase a ticket.
Additionally, we expect to continue to invest in technology that is designed to both assist customers with
self-service and allow us to make better operational decisions, while lowering our operating costs.
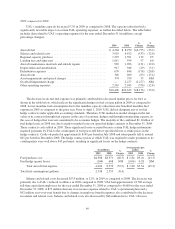
Capacity. We announced new service to several international destinations in 2010, including Lagos, Nigeria,
Cairo, Egypt and Auckland, New Zealand. We do not anticipate significant capacity growth in 2011 unless the
level of demand for air travel, economic conditions and the expected financial benefit sufficiently justify such
growth. We expect only modest capacity growth for 2011, with both our mainline and consolidated capacity
increasing between 1.0% and 2.0%. We expect consolidated domestic capacity to decrease between 0.5% and
1.5% and consolidated international capacity to increase between 4.5% and 5.5%. Should fuel prices increase
significantly, we would likely adjust our capacity plans downward.
Our future ability to grow or improve our efficiency could be adversely impacted by manufacturer delays in
aircraft deliveries. We have not received a revised 787 delivery schedule, but we currently expect the first of our
Boeing 787 aircraft to be delivered in the first half of 2012.
Labor Costs. Our ability to achieve and sustain profitability also depends on continuing our efforts to
implement and maintain a more competitive cost structure. As of December 31, 2010, United and Continental
had approximately 82% and 60%, respectively, of employees represented by unions. All of United’s union-
represented employees and 53% of Continental’s union-represented employees are covered by collective
bargaining agreements that are currently amendable. We are in the process of negotiating amended collective
bargaining agreements with our employee groups. The Company cannot predict the outcome of negotiations with
its unionized employee groups, although significant increases in the pay and benefits resulting from new
collective bargaining agreements could have an adverse financial impact on the Company. See Note 17 to the
financial statements in Item 8 and Item 1, Business, for additional information.
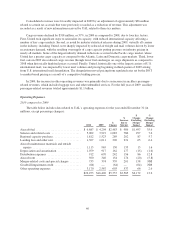
Results of Operations
To provide a more meaningful comparison of UAL’s 2010 financial performance to 2009, we have
quantified the increases relating to our operating results that are due to Continental operations after the Merger
closing date. The increases due to the Merger, presented in the tables below, represent actual Continental results
for the fourth quarter of 2010. The discussion of UAL’s results excludes the impact of Continental’s results in the
fourth quarter of 2010. Intercompany transactions were immaterial.
43