United Airlines 2010 Annual Report Download - page 47
Download and view the complete annual report
Please find page 47 of the 2010 United Airlines annual report below. You can navigate through the pages in the report by either clicking on the pages listed below, or by using the keyword search tool below to find specific information within the annual report.-
 1
1 -
2
-
3
-
4
-
5
-
6
-
7
-
8
-
9
-
10
-
11
-
12
-
13
-
14
-
15
-
16
-
17
-
18
-
19
-
20
-
21
-
22
-
23
-
24
-
25
-
26
-
27
-
28
-
29
-
30
-
31
-
32
-
33
-
34
-
35
-
36
-
 37
37 -
 38
38 -
 39
39 -
 40
40 -
 41
41 -
 42
42 -
 43
43 -
 44
44 -
 45
45 -
 46
46 -
 47
47 -
 48
48 -
 49
49 -
 50
50 -
 51
51 -
 52
52 -
 53
53 -
 54
54 -
 55
55 -
 56
56 -
 57
57 -
58
-
59
-
60
-
61
-
62
-
63
-
64
-
65
-
66
-
67
-
68
-
69
-
70
-
71
-
72
-
73
-
74
-
75
-
76
-
77
-
78
-
79
-
80
-
81
-
82
-
83
-
84
-
85
-
86
-
87
-
88
-
89
-
90
-
91
-
92
-
93
-
94
-
95
-
96
-
97
-
98
-
99
-
100
-
101
-
102
-
103
-
104
-
105
-
106
-
107
-
108
-
109
-
110
-
111
-
112
-
113
-
114
-
115
-
116
-
117
-
118
-
119
-
120
-
121
-
122
-
123
-
124
-
125
-
126
-
127
-
128
-
129
-
130
-
131
-
132
-
133
-
134
-
135
-
136
-
137
-
138
-
139
-
140
-
141
-
142
-
143
-
144
-
145
-
146
-
147
-
148
-
149
-
150
-
151
-
152
-
153
-
154
-
155
-
156
-
157
-
158
-
159
-
160
-
161
-
162
-
163
-
164
-
165
-
166
-
167
-
168
-
169
-
170
-
171
-
172
-
173
-
174
-
175
-
176
-
177
-
178
-
179
-
180
-
181
-
182
-
183
-
184
-
185
-
186
-
187
-
188
-
189
-
190
-
191
-
192
-
193
-
194
-
195
-
196
-
197
-
198
-
199
-
200
-
201
-
202
-
203
-
204
-
205
-
206
-
207
-
208
-
209
-
210
-
211
-
212
-
213
-
214
-
215
-
216
-
217
-
218
-
219
-
220
-
221
-
222
-
223
-
224
 |
 |

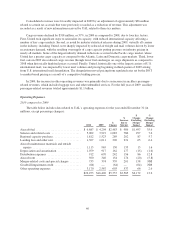
Excluding the impact of the Merger, other operating revenue was up 14% in 2010, as compared to 2009,
which was primarily due to growth in ancillary passenger-related charges such as baggage fees.
2009 compared to 2008
The table below illustrates the year-over-year percentage change in UAL’s operating revenues for the years
ended December 31 (in millions, except percentage changes):
2009 2008
$
Change
%
Change
Passenger—Mainline ......................................... $11,313 $14,822 $(3,509) (23.7)
Passenger—Regional ......................................... 2,884 2,981 (97) (3.3)
Total passenger revenue ................................... 14,197 17,803 (3,606) (20.3)
Cargo ..................................................... 536 854 (318) (37.2)
Other operating revenue ....................................... 1,602 1,537 65 4.2
$16,335 $20,194 $(3,859) (19.1)
The table below presents UAL’s passenger revenues and selected operating data based on geographic
region:
Increase (decrease) in 2009 from 2008:
Domestic Pacific Atlantic
Latin
America
Total
Mainline
Regional
Carriers Consolidated
Passenger revenue (in millions) .... $(2,007) $ (910) $ (403) $ (189) $(3,509) $ (97) $(3,606)
Passenger revenue ............... (23.5)% (28.9)% (15.4)% (35.8)% (23.7)% (3.3)% (20.3)%
Average fare per passenger ........ (13.2)% (23.6)% (13.1)% (17.1)% (14.1)% (11.1)% (15.4)%
Yield ......................... (15.8)% (20.5)% (13.2)% (20.5)% (16.4)% (14.6)% (14.7)%
PRASM ....................... (14.6)% (19.7)% (13.2)% (21.2)% (15.5)% (13.0)% (13.8)%
Average length of aircraft flight .... 1.5% (5.4)% (0.5)% (1.6)% 1.4% 4.7% (1.9)%
Passengers ..................... (11.9)% (6.9)% (2.7)% (22.6)% (11.2)% 8.9% (5.8)%
RPMs ......................... (9.2)% (10.6)% (2.5)% (19.2)% (8.7)% 13.3% (6.5)%
ASMs ......................... (10.4)% (11.5)% (2.6)% (18.5)% (9.7)% 11.2% (7.4)%
Passenger load factor ............. 1.1pts. 0.8 pts. 0.1 pts. (0.7) pts. 0.9 pts. 1.4 pts. 0.8 pts.
Consistent with the rest of the airline industry, UAL’s decline in PRASM was partially driven by a
precipitous decline in worldwide travel demand as a result of the severe global recession. Two key factors had a
distinct impact on UAL’s revenue during 2009. First, network composition played a role in overall unit revenue
decline. International markets, in particular the Pacific region, experienced more significant unit revenue declines
as compared to the other regions. Given UAL’s significant international network and its historic relative
contribution to passenger revenue, UAL’s revenue was significantly impacted by the contraction in travel
demand in the Pacific. Second, while demand generally declined across all geographic regions, premium and
business demand declined more significantly than leisure demand. As UAL’s business model is strongly aligned
to serve premium and business travelers, both internationally and domestically, the decrease in travel by business
travelers and the buy-down from premium class to economy class by some business travelers caused a significant
negative impact on UAL’s results in 2009.
In 2009, consolidated yield decreased 14.7% as compared to 2008, while consolidated average fare per
passenger decreased 15.4% in the same period. The yield and average fare decreases were primarily a result of
the weak economic environment in 2009 and the resulting adverse economic impacts on UAL, as discussed
above. Consolidated revenue was also negatively impacted by lower volumes of traffic due to the effects of the
severe global recession.
45