United Airlines 2010 Annual Report Download - page 53
Download and view the complete annual report
Please find page 53 of the 2010 United Airlines annual report below. You can navigate through the pages in the report by either clicking on the pages listed below, or by using the keyword search tool below to find specific information within the annual report.-
 1
1 -
2
-
3
-
4
-
5
-
6
-
7
-
8
-
9
-
10
-
11
-
12
-
13
-
14
-
15
-
16
-
17
-
18
-
19
-
20
-
21
-
22
-
23
-
24
-
25
-
26
-
27
-
28
-
29
-
30
-
31
-
32
-
33
-
34
-
35
-
36
-
37
-
38
-
39
-
40
-
41
-
42
-
 43
43 -
 44
44 -
 45
45 -
 46
46 -
 47
47 -
 48
48 -
 49
49 -
 50
50 -
 51
51 -
 52
52 -
 53
53 -
 54
54 -
 55
55 -
 56
56 -
 57
57 -
 58
58 -
 59
59 -
 60
60 -
 61
61 -
 62
62 -
 63
63 -
64
-
65
-
66
-
67
-
68
-
69
-
70
-
71
-
72
-
73
-
74
-
75
-
76
-
77
-
78
-
79
-
80
-
81
-
82
-
83
-
84
-
85
-
86
-
87
-
88
-
89
-
90
-
91
-
92
-
93
-
94
-
95
-
96
-
97
-
98
-
99
-
100
-
101
-
102
-
103
-
104
-
105
-
106
-
107
-
108
-
109
-
110
-
111
-
112
-
113
-
114
-
115
-
116
-
117
-
118
-
119
-
120
-
121
-
122
-
123
-
124
-
125
-
126
-
127
-
128
-
129
-
130
-
131
-
132
-
133
-
134
-
135
-
136
-
137
-
138
-
139
-
140
-
141
-
142
-
143
-
144
-
145
-
146
-
147
-
148
-
149
-
150
-
151
-
152
-
153
-
154
-
155
-
156
-
157
-
158
-
159
-
160
-
161
-
162
-
163
-
164
-
165
-
166
-
167
-
168
-
169
-
170
-
171
-
172
-
173
-
174
-
175
-
176
-
177
-
178
-
179
-
180
-
181
-
182
-
183
-
184
-
185
-
186
-
187
-
188
-
189
-
190
-
191
-
192
-
193
-
194
-
195
-
196
-
197
-
198
-
199
-
200
-
201
-
202
-
203
-
204
-
205
-
206
-
207
-
208
-
209
-
210
-
211
-
212
-
213
-
214
-
215
-
216
-
217
-
218
-
219
-
220
-
221
-
222
-
223
-
224
 |
 |

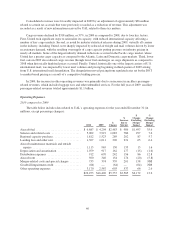
Nonoperating Income (Expense).
2010 compared to 2009
The following table illustrates the year-over-year dollar and percentage changes in UAL’s nonoperating
income (expense) (in millions except percentage changes):
2010 2009
Favorable/(Unfavorable)
$
Change
Increase
due to
Merger
$
Change
Excluding
Merger
Impact
%
Change
Excluding
Merger
Impact
Interest expense ................................ $(798) $(577) $(221) $(86) $(135) (23.4)
Interest income ................................ 15 19 (4) 3 (7) (36.8)
Interest capitalized ............................. 15 10 5 4 1 10.0
Miscellaneous, net ............................. 42 37 5 2 3 8.1
Total .................................... $(726) $(511) $(215) $(77) $(138) (27.0)
The increase in interest expense in 2010 as compared to 2009, excluding the Merger impact, was primarily
due to higher interest rates on average debt outstanding in 2010 as compared to comparable rates on average debt
outstanding in 2009, as certain of the Company’s recent financings have terms with higher interest rates as
compared to debt that has been repaid. The higher interest rates were due to distressed capital markets and the
Company’s credit and liquidity outlook at the time of the financings.
In 2010, miscellaneous, net included a gain of $21 million from the distribution to United of the remaining
United Series 2001-1 enhanced equipment trust certificate (“EETC”) assets upon repayment of the note
obligations. In addition, miscellaneous, net included $10 million of hedge ineffectiveness gains in 2010 on fuel
hedge contracts that were designated as cash flow hedges, as compared to $31 million of fuel hedge gains in
2009. The fuel hedge gains in 2009 resulted from hedge contracts that were not designated as cash flow hedges,
as further discussed below under 2009 compared to 2008.
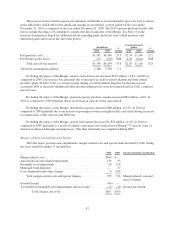
2009 compared to 2008
The following table illustrates the year-over-year dollar and percentage changes in UAL’s nonoperating
income (expense) (in millions, except percentage changes):
2009 2008
Favorable/
(Unfavorable)
Change
$ %
Interest expense ........................................ $(577) $(571) $ (6) (1.1)
Interest income ......................................... 19 112 (93) (83.0)
Interest capitalized ...................................... 10 20 (10) (50.0)
Miscellaneous, net ...................................... 37 (550) 587 NM
Total ............................................... $(511) $(989) $478 48.3
Nonoperating expenses decreased by $478 million in 2009 as compared to 2008. The decrease was
primarily due to a $559 million improvement in net fuel hedge gains and losses, partially offset by a $93 million
decrease in interest income due to lower investment yields as a result of decreased market rates.
As described in the discussion of changes in aircraft fuel expense above, prior to April 1, 2010, UAL did not
designate any of its fuel hedges as cash flow hedges under applicable accounting standards. UAL had a
significant amount of hedges that it did not consider economic hedges and classified the related hedge losses in
miscellaneous nonoperating expense. As noted above, the significant losses in 2008 were due to significant fuel
price declines below the contractual prices in UAL’s fuel hedge portfolio that existed during and at the end of
51