United Airlines 2010 Annual Report Download - page 129
Download and view the complete annual report
Please find page 129 of the 2010 United Airlines annual report below. You can navigate through the pages in the report by either clicking on the pages listed below, or by using the keyword search tool below to find specific information within the annual report.-
 1
1 -
2
-
3
-
4
-
5
-
6
-
7
-
8
-
9
-
10
-
11
-
12
-
13
-
14
-
15
-
16
-
17
-
18
-
19
-
20
-
21
-
22
-
23
-
24
-
25
-
26
-
27
-
28
-
29
-
30
-
31
-
32
-
33
-
34
-
35
-
36
-
37
-
38
-
39
-
40
-
41
-
42
-
43
-
44
-
45
-
46
-
47
-
48
-
49
-
50
-
51
-
52
-
53
-
54
-
55
-
56
-
57
-
58
-
59
-
60
-
61
-
62
-
63
-
64
-
65
-
66
-
67
-
68
-
69
-
70
-
71
-
72
-
73
-
74
-
75
-
76
-
77
-
78
-
79
-
80
-
81
-
82
-
83
-
84
-
85
-
86
-
87
-
88
-
89
-
90
-
91
-
92
-
93
-
94
-
95
-
96
-
97
-
98
-
99
-
100
-
101
-
102
-
103
-
104
-
105
-
106
-
107
-
108
-
109
-
110
-
111
-
112
-
113
-
114
-
115
-
116
-
117
-
118
-
 119
119 -
 120
120 -
 121
121 -
 122
122 -
 123
123 -
 124
124 -
 125
125 -
 126
126 -
 127
127 -
 128
128 -
 129
129 -
 130
130 -
 131
131 -
 132
132 -
 133
133 -
 134
134 -
 135
135 -
 136
136 -
 137
137 -
 138
138 -
 139
139 -
140
-
141
-
142
-
143
-
144
-
145
-
146
-
147
-
148
-
149
-
150
-
151
-
152
-
153
-
154
-
155
-
156
-
157
-
158
-
159
-
160
-
161
-
162
-
163
-
164
-
165
-
166
-
167
-
168
-
169
-
170
-
171
-
172
-
173
-
174
-
175
-
176
-
177
-
178
-
179
-
180
-
181
-
182
-
183
-
184
-
185
-
186
-
187
-
188
-
189
-
190
-
191
-
192
-
193
-
194
-
195
-
196
-
197
-
198
-
199
-
200
-
201
-
202
-
203
-
204
-
205
-
206
-
207
-
208
-
209
-
210
-
211
-
212
-
213
-
214
-
215
-
216
-
217
-
218
-
219
-
220
-
221
-
222
-
223
-
224
 |
 |

United
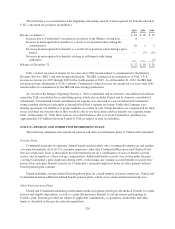
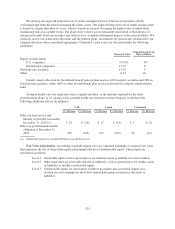
Fixed income and equity. The fair market value reflects the combined market value of the underlying stock
and/or market value of the underlying debt securities. The market value of the common stock portion, if any, of
the fund is based on the primary-exchange closing prices of the stocks of the fund.
Insurance contract and deposit administration fund. Both of these investments are stable investment
vehicles structured to provide investment income. Generally, the deposit administration fund assets are not
subject to market volatilities as the fund earns a stated return, determined at the beginning of each year.
Similarly, the insurance contract is not subject to market volatility. Due to the conservative nature of the
underlying assets, the cost of these investments approximates their fair value.
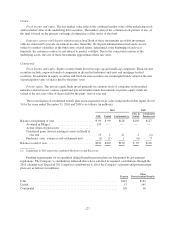
Continental
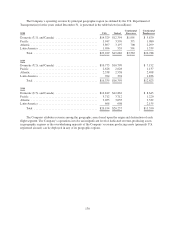
Fixed income and equity. Equity security funds invest in large-cap and small-cap companies. Fixed-income
securities include corporate bonds of companies in diversified industries and asset and mortgage-backed
securities. Investments in equity securities and fixed-income securities are commingled funds valued at the unit
of participation value of shares held by the plans’ trust.
Private equity. The private equity funds invest primarily in common stock of companies in diversified
industries and in buyout, venture capital and special situation funds. Investments in private equity funds are
valued at the net asset value of shares held by the plans’ trust at year end.
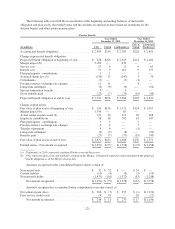
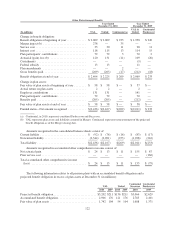
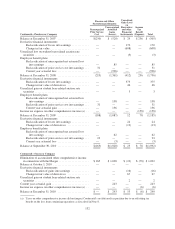
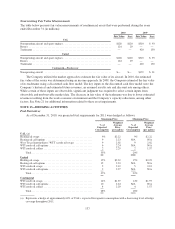
The reconciliation of our defined benefit plan assets measured at fair value using unobservable inputs (Level
3) for the years ended December 31, 2010 and 2009 is as follows (in millions):
2010 2009
UAL United Continental (a)
UAL &
United
Continental
Predecessor
Balance at beginning of year ......................... $ 99 $ 99 $128 $103 $127
Assumed in Merger ............................. 139 — — — —
Actual return on plan assets: ......................
Unrealized gains (losses) relating to assets still held at
year end .................................... 13 2 21 2 (2)
Purchases, sales, issuances and settlements (net) ...... (1) (1) 1 (6) 3
Balance at end of year ............................... $250 $100 $150 $ 99 $128
(a) Continental in 2010 represents combined Predecessor and Successor.
Funding requirements for tax-qualified defined benefit pension plans are determined by government
regulations. The Company’s contributions reflected above have satisfied its required contributions through the
2010 calendar year. Expected 2011 employer contributions to all of the Company’s pension and postretirement
plans are as follows (in millions):
Pension
Other
Postretirement Benefits
UAL ............................................................. $141 $161
United ............................................................ 15 145
Continental ........................................................ 126 16
127