United Airlines 2010 Annual Report Download - page 168
Download and view the complete annual report
Please find page 168 of the 2010 United Airlines annual report below. You can navigate through the pages in the report by either clicking on the pages listed below, or by using the keyword search tool below to find specific information within the annual report.-
 1
1 -
2
-
3
-
4
-
5
-
6
-
7
-
8
-
9
-
10
-
11
-
12
-
13
-
14
-
15
-
16
-
17
-
18
-
19
-
20
-
21
-
22
-
23
-
24
-
25
-
26
-
27
-
28
-
29
-
30
-
31
-
32
-
33
-
34
-
35
-
36
-
37
-
38
-
39
-
40
-
41
-
42
-
43
-
44
-
45
-
46
-
47
-
48
-
49
-
50
-
51
-
52
-
53
-
54
-
55
-
56
-
57
-
58
-
59
-
60
-
61
-
62
-
63
-
64
-
65
-
66
-
67
-
68
-
69
-
70
-
71
-
72
-
73
-
74
-
75
-
76
-
77
-
78
-
79
-
80
-
81
-
82
-
83
-
84
-
85
-
86
-
87
-
88
-
89
-
90
-
91
-
92
-
93
-
94
-
95
-
96
-
97
-
98
-
99
-
100
-
101
-
102
-
103
-
104
-
105
-
106
-
107
-
108
-
109
-
110
-
111
-
112
-
113
-
114
-
115
-
116
-
117
-
118
-
119
-
120
-
121
-
122
-
123
-
124
-
125
-
126
-
127
-
128
-
129
-
130
-
131
-
132
-
133
-
134
-
135
-
136
-
137
-
138
-
139
-
140
-
141
-
142
-
143
-
144
-
145
-
146
-
147
-
148
-
149
-
150
-
151
-
152
-
153
-
154
-
155
-
156
-
157
-
 158
158 -
 159
159 -
 160
160 -
 161
161 -
 162
162 -
 163
163 -
 164
164 -
 165
165 -
 166
166 -
 167
167 -
 168
168 -
 169
169 -
 170
170 -
 171
171 -
 172
172 -
 173
173 -
 174
174 -
 175
175 -
 176
176 -
 177
177 -
 178
178 -
179
-
180
-
181
-
182
-
183
-
184
-
185
-
186
-
187
-
188
-
189
-
190
-
191
-
192
-
193
-
194
-
195
-
196
-
197
-
198
-
199
-
200
-
201
-
202
-
203
-
204
-
205
-
206
-
207
-
208
-
209
-
210
-
211
-
212
-
213
-
214
-
215
-
216
-
217
-
218
-
219
-
220
-
221
-
222
-
223
-
224
 |
 |

In addition to the accruals activity presented above, UAL and United recorded accruals related to UAL
Corporation’s emergence from Chapter 11 bankruptcy protection in 2006. As of December 31, 2008 and 2007,
this bankruptcy-related reserve had a balance of $96 million and $98 million, respectively. During 2009, the
restructuring accruals were finalized with payments of $58 million, expense accrual adjustments of $29 million,
and reclassifications of $67 million. These reclassifications primarily relate to lease settlements that are being
amortized over amended lease terms.
Due to extreme fuel price volatility, tight credit markets, the uncertain economic environment, as well as
other uncertainties, the Company can provide no assurance that a material impairment charge will not occur in a
future period. The Company will continue to monitor circumstances and events in future periods to determine
whether additional asset impairment testing is warranted.
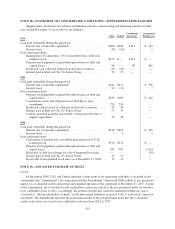
NOTE 22—SELECTED QUARTERLY FINANCIAL DATA (UNAUDITED)
UAL Quarter Ended
(In millions, except per share amounts) March 31 June 30 September 30 December 31
2010
Operating revenues ..................................... $4,241 $5,161 $5,394 $8,433
Income (loss) from operations ............................ 69 434 535 (82)
Net income (loss) ...................................... (82) 273 387 (325)
Basic earnings (loss) per share ............................ (0.49) 1.62 2.30 (1.01)
Diluted earnings (loss) per share .......................... (0.49) 1.29 1.75 (1.01)
2009
Operating revenues ..................................... $3,691 $4,018 $4,433 $4,193
Income (loss) from operations ............................ (282) 107 88 (74)
Net income (loss) ...................................... (382) 28 (57) (240)
Basic and diluted earnings (loss) per share .................. (2.64) 0.19 (0.39) (1.44)
UAL’s quarterly financial data is subject to seasonal fluctuations and historically its second and third
quarter financial results, which reflect higher travel demand, are better than its first and fourth quarter financial
results. UAL’s quarterly results were impacted by the following significant items:
UAL Quarter Ended
(In millions) March 31 June 30 September 30 December 31
2010
Operating earnings:
Merger-related costs ................................ $— $ 28 $ 44 $493
Asset impairments .................................. 17 73 22 53
Lease termination and other special items ............... 1 5 (3) —
Goodwill impairment credit .......................... — — — (64)
Total merger-related costs and special charges in operating
income (loss) ........................................ $ 18 $106 $ 63 $482
Non-cash fuel hedge mark-to-market (gains) losses ........... $ (31) $ 37 $ 12 $ 14
Frequent flyer accounting change (Note 2(h)) ................ $ 64 $ 75 $ 65 $ 45
2009
Operating earnings:
Asset impairments .................................. $110 $ 40 $ 19 $ 74
LAX municipal bond litigation ........................ — 27 — —
Lease termination and other special items ............... 9 21 24 50
Total special charges in operating income (loss) .............. $119 $ 88 $ 43 $124
Fuel hedge mark-to-market:
Non-cash MTM fuel hedge gains ...................... $(191) $(305) $ (25) $ (65)
Non-operating non-cash MTM fuel hedge gains .......... (72) (135) (34) (38)
See Note 21 for further discussion of these items.
166