United Airlines 2010 Annual Report Download - page 113
Download and view the complete annual report
Please find page 113 of the 2010 United Airlines annual report below. You can navigate through the pages in the report by either clicking on the pages listed below, or by using the keyword search tool below to find specific information within the annual report.-
 1
1 -
2
-
3
-
4
-
5
-
6
-
7
-
8
-
9
-
10
-
11
-
12
-
13
-
14
-
15
-
16
-
17
-
18
-
19
-
20
-
21
-
22
-
23
-
24
-
25
-
26
-
27
-
28
-
29
-
30
-
31
-
32
-
33
-
34
-
35
-
36
-
37
-
38
-
39
-
40
-
41
-
42
-
43
-
44
-
45
-
46
-
47
-
48
-
49
-
50
-
51
-
52
-
53
-
54
-
55
-
56
-
57
-
58
-
59
-
60
-
61
-
62
-
63
-
64
-
65
-
66
-
67
-
68
-
69
-
70
-
71
-
72
-
73
-
74
-
75
-
76
-
77
-
78
-
79
-
80
-
81
-
82
-
83
-
84
-
85
-
86
-
87
-
88
-
89
-
90
-
91
-
92
-
93
-
94
-
95
-
96
-
97
-
98
-
99
-
100
-
101
-
102
-
 103
103 -
 104
104 -
 105
105 -
 106
106 -
 107
107 -
 108
108 -
 109
109 -
 110
110 -
 111
111 -
 112
112 -
 113
113 -
 114
114 -
 115
115 -
 116
116 -
 117
117 -
 118
118 -
 119
119 -
 120
120 -
 121
121 -
 122
122 -
 123
123 -
124
-
125
-
126
-
127
-
128
-
129
-
130
-
131
-
132
-
133
-
134
-
135
-
136
-
137
-
138
-
139
-
140
-
141
-
142
-
143
-
144
-
145
-
146
-
147
-
148
-
149
-
150
-
151
-
152
-
153
-
154
-
155
-
156
-
157
-
158
-
159
-
160
-
161
-
162
-
163
-
164
-
165
-
166
-
167
-
168
-
169
-
170
-
171
-
172
-
173
-
174
-
175
-
176
-
177
-
178
-
179
-
180
-
181
-
182
-
183
-
184
-
185
-
186
-
187
-
188
-
189
-
190
-
191
-
192
-
193
-
194
-
195
-
196
-
197
-
198
-
199
-
200
-
201
-
202
-
203
-
204
-
205
-
206
-
207
-
208
-
209
-
210
-
211
-
212
-
213
-
214
-
215
-
216
-
217
-
218
-
219
-
220
-
221
-
222
-
223
-
224
 |
 |

Continental Predecessor
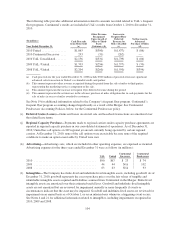
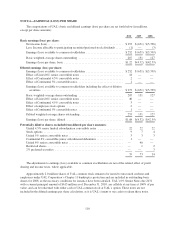
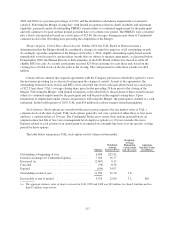
The computations of Continental Predecessor’s basic and diluted earnings (loss) per share for the periods
Continental had outstanding publicly-traded equity securities are set forth below (in millions, except per share
amounts):
Nine Months
Ended
September 30,
2010
Year Ended
December 31,
2009 2008
Basic earnings (loss) per share:
Net income (loss) .............................................. $441 $(282) $ (586)
Earnings (loss) available to common stockholders ..................... $441 $(282) $ (586)
Basic weighted-average shares outstanding .......................... 140 129 106
Earnings (loss) per share, basic .................................... $3.16 $(2.18) $(5.54)
Diluted earnings (loss) per share:
Earnings (loss) available to common stockholders ..................... $441 $(282) $ (586)
Effect of 5% convertible notes .................................... 10 — —
Effect of 6% convertible junior subordinated debentures ................ 10 — —
Effect of 4.5% convertible notes ................................... 7 — —
Earnings (loss) available to common stockholders including the effect of
dilutive securities ............................................ $468 $(282) $ (586)
Basic weighted-average shares outstanding .......................... 140 129 106
Effect of 4.5% convertible notes ................................... 12 — —
Effect of 5% convertible notes .................................... 9 — —
Effect of 6% convertible junior subordinated debentures ................ 4 — —
Effect of employee stock options .................................. 2 — —
Dilutive weighted-average shares outstanding ........................ 167 129 106
Earnings (loss) per share, diluted .................................. $2.81 $(2.18) $(5.54)
The adjustments to earnings (loss) available to common stockholders are net of the related effect of profit
sharing and income taxes, where applicable.
Approximately 2 million, 8 million and 8 million weighted average options to purchase shares of
Continental common stock for the nine months ended September 30, 2010 and the years ended December 31,
2009 and 2008, respectively, were excluded from the computation of diluted earnings (loss) per share because the
effect of including the options would have been antidilutive. In addition, approximately 14 million and 13 million
potential shares of Continental common stock related to Continental’s convertible debt securities were excluded
from the computation of diluted loss per share for the years ended December 31, 2009 and 2008, respectively,
because they were antidilutive.
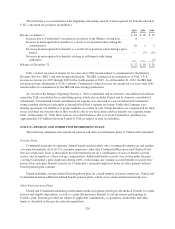
NOTE 7—SHARE-BASED COMPENSATION PLANS
Prior to the Merger, UAL and Continental maintained separate share-based compensation plans. These plans
provide for grants of qualified and non-qualified stock options, stock appreciation rights, restricted stock awards,
restricted stock units (“RSUs”), performance compensation awards, performance units, cash incentive awards
and other types of equity-based and equity-related awards. As part of the Merger, UAL assumed all of
Continental’s outstanding share-based compensation plans.
111