United Airlines 2010 Annual Report Download - page 56
Download and view the complete annual report
Please find page 56 of the 2010 United Airlines annual report below. You can navigate through the pages in the report by either clicking on the pages listed below, or by using the keyword search tool below to find specific information within the annual report.-
 1
1 -
2
-
3
-
4
-
5
-
6
-
7
-
8
-
9
-
10
-
11
-
12
-
13
-
14
-
15
-
16
-
17
-
18
-
19
-
20
-
21
-
22
-
23
-
24
-
25
-
26
-
27
-
28
-
29
-
30
-
31
-
32
-
33
-
34
-
35
-
36
-
37
-
38
-
39
-
40
-
41
-
42
-
43
-
44
-
45
-
 46
46 -
 47
47 -
 48
48 -
 49
49 -
 50
50 -
 51
51 -
 52
52 -
 53
53 -
 54
54 -
 55
55 -
 56
56 -
 57
57 -
 58
58 -
 59
59 -
 60
60 -
 61
61 -
 62
62 -
 63
63 -
 64
64 -
 65
65 -
 66
66 -
67
-
68
-
69
-
70
-
71
-
72
-
73
-
74
-
75
-
76
-
77
-
78
-
79
-
80
-
81
-
82
-
83
-
84
-
85
-
86
-
87
-
88
-
89
-
90
-
91
-
92
-
93
-
94
-
95
-
96
-
97
-
98
-
99
-
100
-
101
-
102
-
103
-
104
-
105
-
106
-
107
-
108
-
109
-
110
-
111
-
112
-
113
-
114
-
115
-
116
-
117
-
118
-
119
-
120
-
121
-
122
-
123
-
124
-
125
-
126
-
127
-
128
-
129
-
130
-
131
-
132
-
133
-
134
-
135
-
136
-
137
-
138
-
139
-
140
-
141
-
142
-
143
-
144
-
145
-
146
-
147
-
148
-
149
-
150
-
151
-
152
-
153
-
154
-
155
-
156
-
157
-
158
-
159
-
160
-
161
-
162
-
163
-
164
-
165
-
166
-
167
-
168
-
169
-
170
-
171
-
172
-
173
-
174
-
175
-
176
-
177
-
178
-
179
-
180
-
181
-
182
-
183
-
184
-
185
-
186
-
187
-
188
-
189
-
190
-
191
-
192
-
193
-
194
-
195
-
196
-
197
-
198
-
199
-
200
-
201
-
202
-
203
-
204
-
205
-
206
-
207
-
208
-
209
-
210
-
211
-
212
-
213
-
214
-
215
-
216
-
217
-
218
-
219
-
220
-
221
-
222
-
223
-
224
 |
 |

Continental
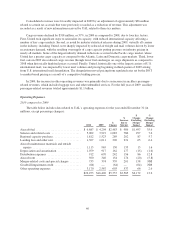
The table below presents the Continental Successor and Predecessor periods in 2010. The combined
presentation for the year ended December 31, 2010 does not represent a GAAP presentation. Management
believes that the combined non-GAAP results provide a more meaningful comparison to the full year 2009.
Continental’s operating income and net income in the combined 2010 period were $698 million and $346
million, respectively, as compared to operating and net losses of $144 million and $282 million, respectively, in
2009. This improvement was largely due to the improvement in global economic conditions following the severe
recession in 2009, consistent with the improvement in UAL’s results described above.
(in millions)
Successor
Three
Months
Ended
December 31,
2010
Predecessor
Nine Months
Ended
September 30,
2010
Combined
2010
Predecessor
Year Ended
December 31,
2009
%
Change
Operating Revenue:
Passenger revenue ....................... $3,167 $ 9,503 $12,670 $11,040 14.8
Cargo and other revenue .................. 396 1,285 1,681 1,583 6.2
Total revenue ....................... $3,563 $10,788 $14,351 $12,623 13.7
Operating Expenses:
Aircraft fuel ............................ $ 986 $ 2,872 $ 3,858 $ 3,401 13.4
Salaries and related costs .................. 786 2,527 3,313 3,137 5.6
Regional capacity purchase ................ 202 608 810 826 (1.9)
Landing fees and other rent ................ 231 656 887 841 5.5
Aircraft maintenance materials and outside
repairs .............................. 135 399 534 597 (10.6)
Depreciation and amortization .............. 177 380 557 494 12.8
Distribution expenses .................... 156 474 630 537 17.3
Aircraft rent ............................ 174 689 863 934 (7.6)
Merger-related costs and special charges ..... 201 47 248 145 NM
Other operating expenses .................. 537 1,416 1,953 1,855 5.3
Total operating expenses .............. $3,585 $10,068 $13,653 $12,767 6.9
Operating income (loss) ................... $ (22) $ 720 $ 698 $ (144) NM
Nonoperating expense .................... 77 278 355 295 20.3
Total revenues increased 14% in the combined 2010 period, as compared to 2009, primarily due to higher
passenger fares, which were driven by improving global economic conditions and an increased demand for air
travel.
In the combined 2010 period, aircraft fuel expense increased 13% as compared to 2009 primarily due to an
increase in fuel prices. Fuel hedge losses were $9 million and $380 million in 2010 and 2009, respectively.
Continental’s fuel purchase cost, without hedge impacts, increased approximately 27% in 2010 as compared to
2009, which is relatively consistent with UAL’s unhedged cost of fuel summarized in the tables above.
Salaries and related costs increased 6% in the combined 2010 period as compared to 2009. The significant
factors contributing to the increase in 2010 were profit sharing and related taxes of $77 million, variable
incentive compensation and annual employee wage increases.
Aircraft maintenance materials and outside repairs decreased 11% in the combined 2010 period as compared
to 2009 primarily due to the timing of maintenance events and savings from renegotiated rates on certain
contracts.
Continental’s depreciation and amortization expense increased in the combined 2010 period as compared to
2009 primarily due to increased expense in the Successor period associated with recording Continental’s assets at
fair value as of the Merger closing date.
54