United Airlines 2010 Annual Report Download - page 44
Download and view the complete annual report
Please find page 44 of the 2010 United Airlines annual report below. You can navigate through the pages in the report by either clicking on the pages listed below, or by using the keyword search tool below to find specific information within the annual report.-
 1
1 -
2
-
3
-
4
-
5
-
6
-
7
-
8
-
9
-
10
-
11
-
12
-
13
-
14
-
15
-
16
-
17
-
18
-
19
-
20
-
21
-
22
-
23
-
24
-
25
-
26
-
27
-
28
-
29
-
30
-
31
-
32
-
33
-
 34
34 -
 35
35 -
 36
36 -
 37
37 -
 38
38 -
 39
39 -
 40
40 -
 41
41 -
 42
42 -
 43
43 -
 44
44 -
 45
45 -
 46
46 -
 47
47 -
 48
48 -
 49
49 -
 50
50 -
 51
51 -
 52
52 -
 53
53 -
 54
54 -
55
-
56
-
57
-
58
-
59
-
60
-
61
-
62
-
63
-
64
-
65
-
66
-
67
-
68
-
69
-
70
-
71
-
72
-
73
-
74
-
75
-
76
-
77
-
78
-
79
-
80
-
81
-
82
-
83
-
84
-
85
-
86
-
87
-
88
-
89
-
90
-
91
-
92
-
93
-
94
-
95
-
96
-
97
-
98
-
99
-
100
-
101
-
102
-
103
-
104
-
105
-
106
-
107
-
108
-
109
-
110
-
111
-
112
-
113
-
114
-
115
-
116
-
117
-
118
-
119
-
120
-
121
-
122
-
123
-
124
-
125
-
126
-
127
-
128
-
129
-
130
-
131
-
132
-
133
-
134
-
135
-
136
-
137
-
138
-
139
-
140
-
141
-
142
-
143
-
144
-
145
-
146
-
147
-
148
-
149
-
150
-
151
-
152
-
153
-
154
-
155
-
156
-
157
-
158
-
159
-
160
-
161
-
162
-
163
-
164
-
165
-
166
-
167
-
168
-
169
-
170
-
171
-
172
-
173
-
174
-
175
-
176
-
177
-
178
-
179
-
180
-
181
-
182
-
183
-
184
-
185
-
186
-
187
-
188
-
189
-
190
-
191
-
192
-
193
-
194
-
195
-
196
-
197
-
198
-
199
-
200
-
201
-
202
-
203
-
204
-
205
-
206
-
207
-
208
-
209
-
210
-
211
-
212
-
213
-
214
-
215
-
216
-
217
-
218
-
219
-
220
-
221
-
222
-
223
-
224
 |
 |
Outlook
Set forth below is a discussion of the principal matters that we believe could impact our financial and
operating performance and cause our results of operations in future periods to differ materially from our
historical operating results and/or from our anticipated results of operations described in our forward-looking
statements in this report. See Item 1A, Risk Factors, for further discussion of these and other factors that could
affect us.
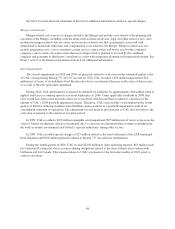
Economic Conditions. The severe global economic recession significantly diminished the demand for air
travel resulting in a difficult financial environment for U.S. network carriers in 2008 and 2009. UAL’s financial
performance improved significantly in 2010 primarily as a result of improving global economic conditions.
Although we continue to see indications that the airline industry is experiencing a recovery, including
strengthening demand and improving revenue, we cannot predict whether the demand for air travel will continue
to improve or the rate of such improvement. Worsening economic conditions resulting in diminished demand for
air travel may impair our ability to sustain the profitability we achieved in 2010.
Merger Integration. UAL expects the Merger to deliver $1.0 billion to $1.2 billion in net annual synergies
on a run-rate basis by 2013, including between $800 million and $900 million of incremental annual revenues, in
large part from expanded customer options resulting from the greater scope and scale of the network, fleet
optimization and additional international service enabled by a broader combined network. UAL expects to realize
between $200 million and $300 million of net cost synergies on a run-rate basis by 2013. In addition, UAL
expects that approximately 25% of its gross synergies will be realized in 2011.
The Company also expects to incur a significant amount of additional substantial merger-related expenses
and charges. There are many factors that could affect the total amount or the timing of those expenses and
charges, and many of the expenses and charges that will be incurred are, by their nature, uncertain and difficult to
estimate accurately. See Note 1 and Note 21 to the financial statements in Item 8 and Item 1A, Risk Factors, for
additional information.
Since the closing of the Merger, the Company has taken significant steps toward the operational integration
of United and Continental. The Company has begun to optimize the gauge and frequency of its fleet in order to
meet travel demand and capitalize on its combined global network efficiently. The introduction of new services
to markets previously not served by either carrier allows the Company to meet the passenger demand created
through the larger, more comprehensive network. The Company is also aligning revenue management and
pricing systems, as well as inventory management strategies, allowing it to create new revenue opportunities and
other efficiencies for the combined company. In addition, the Company has begun to align its employee incentive
programs, including its on-time bonus, perfect attendance and profit sharing programs.
During 2011 and into 2012, the Company expects to continue to harmonize into the new United brand the
products and services offered by its two carriers. The harmonization will involve streamlined customer policies,
aligned check-in and boarding procedures, migration to a single reservations system, and linkage of loyalty
program accounts until the introduction of a combined loyalty program for 2012, among other events. The
Company continues to integrate its operations and, by the end of the second quarter of 2011, expects to be
co-located at more than 35 airports, including all of its hubs. By the end of 2011, the Company expects to receive
a single operating certificate for United and Continental from the FAA. The Company has begun the transition to
selected information technology platforms that support its commercial and operational processes, which is
expected to take more than one year to complete.
Fuel Costs. Fuel costs were less volatile in 2010 as compared to recent years; however, prices increased
significantly late in 2010 and in the first two months of 2011. UAL’s average aircraft fuel price per gallon
including related taxes and excluding hedge impact was $2.35 in 2010 as compared to $1.84 in 2009. If fuel
prices rise significantly from their current levels, we may be unable to raise fares or other fees sufficiently to
fully offset our increased costs. In addition, high fuel prices may impair our ability to sustain the profitability we
42