United Airlines 2010 Annual Report Download - page 114
Download and view the complete annual report
Please find page 114 of the 2010 United Airlines annual report below. You can navigate through the pages in the report by either clicking on the pages listed below, or by using the keyword search tool below to find specific information within the annual report.-
 1
1 -
2
-
3
-
4
-
5
-
6
-
7
-
8
-
9
-
10
-
11
-
12
-
13
-
14
-
15
-
16
-
17
-
18
-
19
-
20
-
21
-
22
-
23
-
24
-
25
-
26
-
27
-
28
-
29
-
30
-
31
-
32
-
33
-
34
-
35
-
36
-
37
-
38
-
39
-
40
-
41
-
42
-
43
-
44
-
45
-
46
-
47
-
48
-
49
-
50
-
51
-
52
-
53
-
54
-
55
-
56
-
57
-
58
-
59
-
60
-
61
-
62
-
63
-
64
-
65
-
66
-
67
-
68
-
69
-
70
-
71
-
72
-
73
-
74
-
75
-
76
-
77
-
78
-
79
-
80
-
81
-
82
-
83
-
84
-
85
-
86
-
87
-
88
-
89
-
90
-
91
-
92
-
93
-
94
-
95
-
96
-
97
-
98
-
99
-
100
-
101
-
102
-
103
-
 104
104 -
 105
105 -
 106
106 -
 107
107 -
 108
108 -
 109
109 -
 110
110 -
 111
111 -
 112
112 -
 113
113 -
 114
114 -
 115
115 -
 116
116 -
 117
117 -
 118
118 -
 119
119 -
 120
120 -
 121
121 -
 122
122 -
 123
123 -
 124
124 -
125
-
126
-
127
-
128
-
129
-
130
-
131
-
132
-
133
-
134
-
135
-
136
-
137
-
138
-
139
-
140
-
141
-
142
-
143
-
144
-
145
-
146
-
147
-
148
-
149
-
150
-
151
-
152
-
153
-
154
-
155
-
156
-
157
-
158
-
159
-
160
-
161
-
162
-
163
-
164
-
165
-
166
-
167
-
168
-
169
-
170
-
171
-
172
-
173
-
174
-
175
-
176
-
177
-
178
-
179
-
180
-
181
-
182
-
183
-
184
-
185
-
186
-
187
-
188
-
189
-
190
-
191
-
192
-
193
-
194
-
195
-
196
-
197
-
198
-
199
-
200
-
201
-
202
-
203
-
204
-
205
-
206
-
207
-
208
-
209
-
210
-
211
-
212
-
213
-
214
-
215
-
216
-
217
-
218
-
219
-
220
-
221
-
222
-
223
-
224
 |
 |

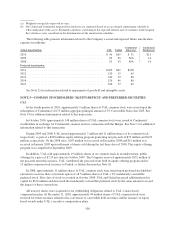
Following the Merger, UAL is now the sole issuer of all stock-based compensation awards. All awards are
recorded as equity or a liability in UAL’s consolidated balance sheet. The stock-based compensation expense
specifically attributable to the employees of United and Continental is directly recorded to salaries and related
costs, or merger-related expense, within each of their respective statements of operations. United and Continental
record an allocation of share-based expense for employees that devote a significant amount of time to both
companies. As United and Continental do not sponsor their own share-based compensation plans, the disclosures
below primarily relate to UAL. See Continental Predecessor below, for share-based compensation disclosures
applicable to Continental prior to the Merger.
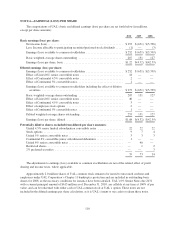
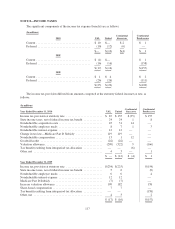
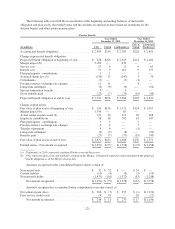
The following table provides information related to UAL share-based compensation plan cost, for the years
ended December 31 (in millions):
2010 2009 2008
Compensation cost: (a), (b)
Share-based awards converted to cash awards (c) ................................. $ 84 $— $—
Restricted stock units ....................................................... 20 10 —
Restricted stock ............................................................ 6 6 18
Stock options .............................................................. 7 5 13
Total ................................................................ $117 $ 21 $ 31
(a) All compensation cost is recorded to Salaries and related benefits, with the exception of $70 million in 2010 that was
recorded in merger-related costs.
(b) In 2010, United and Continental Successor recorded $63 and $54 million, respectively, of compensation cost related to
UAL’s share-based plans. These amounts included $24 million and $46 million that were classified as merger-related
expense by United and Continental, respectively. All UAL share-based compensation expense in 2009 and 2008 was
recorded by United.
(c) As described below, in connection with the Merger, certain awards were converted into fixed cash equivalents.
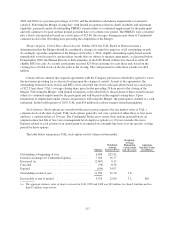
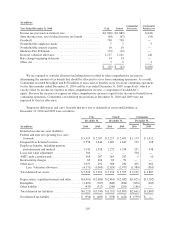
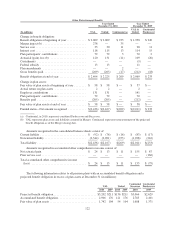
The table below summarizes UAL’s unearned compensation and weighted-average remaining period to
recognize costs for all outstanding share-based awards for the year ended December 31, 2010 ($ in millions):
Unearned
Compensation
Weighted-
Average
Remaining
Period
Share-based awards converted to cash awards (a) .............................. $27 1.6
Restricted stock (b) ...................................................... 9 1.6
Stock options (b) ........................................................ 7 2.2
Total ............................................................. $43
(a) Compensation cost attributable to future service related to unvested awards remaining to be recognized is allocated
equally between United and Continental.
(b) Compensation cost attributable to future service related to unvested awards remaining to be recognized by United and
Continental consists of $10 million and $6 million, respectively.
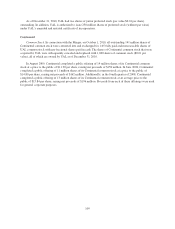
Merger Impacts- Continental Predecessor Share-Based Awards. Prior to completion of the Merger,
Continental had outstanding stock options, non-employee director restricted stock awards and performance
compensation awards (profit based RSUs) that were issued pursuant to its incentive compensation plans. Under
the terms of Continental’s incentive plans, substantially all of the outstanding equity awards fully vested as a
result of the Merger. The equity awards were assumed and issued by UAL using a 1.05 conversion rate and had a
fair value of approximately $78 million at the Merger closing date which was included in the acquisition cost. In
addition, as a result of the Merger, the performance criteria related to the profit based RSUs (“PBRSUs”) was
deemed to be achieved for each open performance period (the three-year periods beginning January 1, 2008,
112