United Airlines 2010 Annual Report Download - page 101
Download and view the complete annual report
Please find page 101 of the 2010 United Airlines annual report below. You can navigate through the pages in the report by either clicking on the pages listed below, or by using the keyword search tool below to find specific information within the annual report.-
 1
1 -
2
-
3
-
4
-
5
-
6
-
7
-
8
-
9
-
10
-
11
-
12
-
13
-
14
-
15
-
16
-
17
-
18
-
19
-
20
-
21
-
22
-
23
-
24
-
25
-
26
-
27
-
28
-
29
-
30
-
31
-
32
-
33
-
34
-
35
-
36
-
37
-
38
-
39
-
40
-
41
-
42
-
43
-
44
-
45
-
46
-
47
-
48
-
49
-
50
-
51
-
52
-
53
-
54
-
55
-
56
-
57
-
58
-
59
-
60
-
61
-
62
-
63
-
64
-
65
-
66
-
67
-
68
-
69
-
70
-
71
-
72
-
73
-
74
-
75
-
76
-
77
-
78
-
79
-
80
-
81
-
82
-
83
-
84
-
85
-
86
-
87
-
88
-
89
-
90
-
 91
91 -
 92
92 -
 93
93 -
 94
94 -
 95
95 -
 96
96 -
 97
97 -
 98
98 -
 99
99 -
 100
100 -
 101
101 -
 102
102 -
 103
103 -
 104
104 -
 105
105 -
 106
106 -
 107
107 -
 108
108 -
 109
109 -
 110
110 -
 111
111 -
112
-
113
-
114
-
115
-
116
-
117
-
118
-
119
-
120
-
121
-
122
-
123
-
124
-
125
-
126
-
127
-
128
-
129
-
130
-
131
-
132
-
133
-
134
-
135
-
136
-
137
-
138
-
139
-
140
-
141
-
142
-
143
-
144
-
145
-
146
-
147
-
148
-
149
-
150
-
151
-
152
-
153
-
154
-
155
-
156
-
157
-
158
-
159
-
160
-
161
-
162
-
163
-
164
-
165
-
166
-
167
-
168
-
169
-
170
-
171
-
172
-
173
-
174
-
175
-
176
-
177
-
178
-
179
-
180
-
181
-
182
-
183
-
184
-
185
-
186
-
187
-
188
-
189
-
190
-
191
-
192
-
193
-
194
-
195
-
196
-
197
-
198
-
199
-
200
-
201
-
202
-
203
-
204
-
205
-
206
-
207
-
208
-
209
-
210
-
211
-
212
-
213
-
214
-
215
-
216
-
217
-
218
-
219
-
220
-
221
-
222
-
223
-
224
 |
 |

though they are free-standing derivatives. As a result, the acquisition date fair value of Continental’s long-term
debt is $71 million lower and the acquisition date fair value of Continental’s other liabilities is $230 million
higher than the UAL amounts shown above.
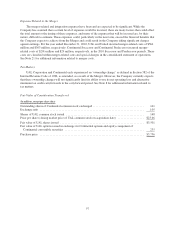
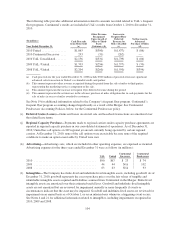
Pro-forma Impact of the Merger
The UAL unaudited pro-forma results presented below include the effects of the Continental acquisition as
if it had been consummated as of January 1, 2009. The pro-forma results include the depreciation and
amortization associated with the acquired tangible and intangible assets, lease fair value adjustments, elimination
of any deferred gains or losses from other comprehensive income and the impact of income changes on profit
sharing expense, among others. However, pro-forma results do not include any anticipated synergies or other
expected benefits of the acquisition. Accordingly, the unaudited pro-forma financial information below is not
necessarily indicative of either future results of operations or results that might have been achieved had the
acquisition been consummated as of January 1, 2009.
(In millions, except per share data)
Year Ended
December 31,
2010 2009
Revenue ....................................................... $33,946 $28,677
Net income (loss) ................................................ 958 (689)
Basic earnings (loss) per share ...................................... 3.02 (2.41)
Diluted earnings (loss) per share .................................... 2.62 (2.41)
(a) Not applicable.
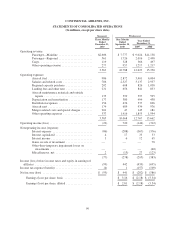
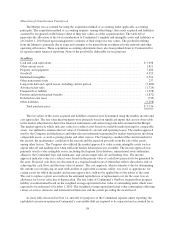
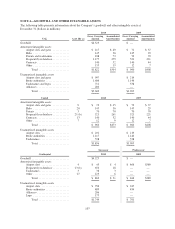
Reclassifications
UAL and United
In 2010, UAL and United changed their classification of certain revenue and expenses in their statements of
consolidated operations. Baggage fees, unaccompanied minor fees and miscellaneous fees moved from mainline
and regional passenger revenue to other operating revenue. Purchased services and cost of third party sales
moved from separate line items to other operating expenses. Salaries and related costs, aircraft fuel, depreciation
and amortization, landing fees and distribution expenses related to regional expenses were reclassified from
regional capacity purchase to their separate line items. Amounts originally reported in UAL’s 2009 Annual
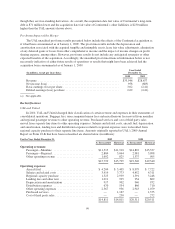
Report on Form 10-K that have been reclassified are shown below (in millions):
For the Year Ended December 31, 2009 2008
As Reclassified Historical As Reclassified Historical
Operating revenues:
Passenger—Mainline ........................... $11,313 $11,910 $14,822 $15,337
Passenger—Regional ............................ 2,884 3,064 2,981 3,098
Other operating revenue ......................... 1,602 825 1,537 905
$15,799 $15,799 $19,340 $19,340
Operating expenses:
Aircraft fuel ................................... $ 4,204 $ 3,405 $ 8,979 $ 7,722
Salaries and related costs ......................... 3,919 3,773 4,452 4,311
Regional capacity purchase ....................... 1,523 2,939 1,391 3,248
Landing fees and other rent ....................... 1,011 905 954 862
Depreciation and amortization .................... 917 902 946 932
Distribution expenses ........................... 670 534 846 710
Other operating expenses ........................ 2,567 956 2,943 1,079
Purchased services .............................. — 1,167 — 1,375
Cost of third party sales .......................... — 230 — 272
$14,811 $14,811 $20,511 $20,511
99