United Airlines 2010 Annual Report Download - page 141
Download and view the complete annual report
Please find page 141 of the 2010 United Airlines annual report below. You can navigate through the pages in the report by either clicking on the pages listed below, or by using the keyword search tool below to find specific information within the annual report.-
 1
1 -
2
-
3
-
4
-
5
-
6
-
7
-
8
-
9
-
10
-
11
-
12
-
13
-
14
-
15
-
16
-
17
-
18
-
19
-
20
-
21
-
22
-
23
-
24
-
25
-
26
-
27
-
28
-
29
-
30
-
31
-
32
-
33
-
34
-
35
-
36
-
37
-
38
-
39
-
40
-
41
-
42
-
43
-
44
-
45
-
46
-
47
-
48
-
49
-
50
-
51
-
52
-
53
-
54
-
55
-
56
-
57
-
58
-
59
-
60
-
61
-
62
-
63
-
64
-
65
-
66
-
67
-
68
-
69
-
70
-
71
-
72
-
73
-
74
-
75
-
76
-
77
-
78
-
79
-
80
-
81
-
82
-
83
-
84
-
85
-
86
-
87
-
88
-
89
-
90
-
91
-
92
-
93
-
94
-
95
-
96
-
97
-
98
-
99
-
100
-
101
-
102
-
103
-
104
-
105
-
106
-
107
-
108
-
109
-
110
-
111
-
112
-
113
-
114
-
115
-
116
-
117
-
118
-
119
-
120
-
121
-
122
-
123
-
124
-
125
-
126
-
127
-
128
-
129
-
130
-
 131
131 -
 132
132 -
 133
133 -
 134
134 -
 135
135 -
 136
136 -
 137
137 -
 138
138 -
 139
139 -
 140
140 -
 141
141 -
 142
142 -
 143
143 -
 144
144 -
 145
145 -
 146
146 -
 147
147 -
 148
148 -
 149
149 -
 150
150 -
 151
151 -
152
-
153
-
154
-
155
-
156
-
157
-
158
-
159
-
160
-
161
-
162
-
163
-
164
-
165
-
166
-
167
-
168
-
169
-
170
-
171
-
172
-
173
-
174
-
175
-
176
-
177
-
178
-
179
-
180
-
181
-
182
-
183
-
184
-
185
-
186
-
187
-
188
-
189
-
190
-
191
-
192
-
193
-
194
-
195
-
196
-
197
-
198
-
199
-
200
-
201
-
202
-
203
-
204
-
205
-
206
-
207
-
208
-
209
-
210
-
211
-
212
-
213
-
214
-
215
-
216
-
217
-
218
-
219
-
220
-
221
-
222
-
223
-
224
 |
 |

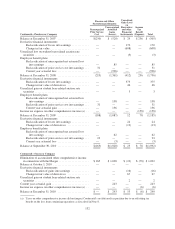
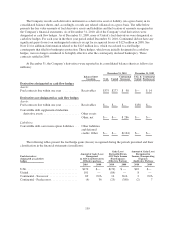
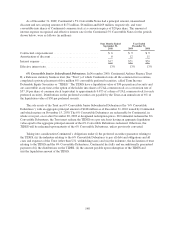
The Company records each derivative instrument as a derivative asset or liability (on a gross basis) in its
consolidated balance sheets,and, accordingly, records any related collateral on a gross basis. The table below
presents the fair value amounts of fuel derivative assets and liabilities and the location of amounts recognized in
the Company’s financial statements. As of December 31, 2010, all of the Company’s fuel derivatives were
designated as cash flow hedges. As of December 31, 2009, none of United’s fuel derivatives were designated as
cash flow hedges. For each year in the three year period ended December 31, 2010, Continental did not have any
significant gains (losses) on undesignated contracts except for recognized losses of $125 million in 2008. See
Note 21 for additional information related to the $125 million loss, which was related to a fuel hedge
counterparty that filed for bankruptcy protection. These hedges, which were initially designated as cash flow
hedges, were no longer considered to be highly effective after the counterparty declared bankruptcy. These
contracts settled in 2009.
At December 31, the Company’s derivatives were reported in its consolidated balance sheets as follows (in
millions):
December 31, 2010 December 31, 2009
Balance Sheet
Location UAL United
Continental
Successor
UAL &
United
Continental
Predecessor
Derivatives designated as cash flow hedges
Assets:
Fuel contracts due within one year ........... Receivables $375 $277 $ 98 $— $ 14
Derivatives not designated as cash flow hedges
Assets:
Fuel contracts due within one year ........... Receivables $— $— $— $138 $—
Convertible debt supplemental indenture
derivative assets ........................ Other assets:
Other, net $— $— $ 286 $— $—
Liabilities:
Convertible debt conversion option liabilities . . . Other liabilities
and deferred
credits: Other $— $— $(164) $— $—
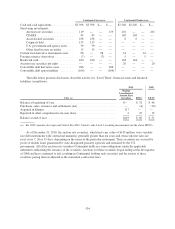
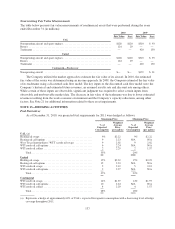
The following tables present the fuel hedge gains (losses) recognized during the periods presented and their
classification in the financial statements (in millions):
Fuel derivatives
designated as cash flow
hedges
Amount of Gain (Loss)
Recognized
in AOCI on Derivatives
(Effective portion)
Gain (Loss)
Reclassified from
AOCI into Income
(Fuel Expense)
(Effective Portion)
Amount of Gain (Loss)
Recognized in
Income (Nonoperating
Expense)
(Ineffective Portion)
2010 2009 2010 2009 2010 2009
UAL .................................. $170 $— $(70) $ — $10 $—
United ................................. 101 — (84) — 8 —
Continental - Successor ................... 69 N/A 14 N/A 2 N/A
Continental - Predecessor .................. (4) 36 (23) (380) (2) 7
139