United Airlines 2010 Annual Report Download - page 51
Download and view the complete annual report
Please find page 51 of the 2010 United Airlines annual report below. You can navigate through the pages in the report by either clicking on the pages listed below, or by using the keyword search tool below to find specific information within the annual report.-
 1
1 -
2
-
3
-
4
-
5
-
6
-
7
-
8
-
9
-
10
-
11
-
12
-
13
-
14
-
15
-
16
-
17
-
18
-
19
-
20
-
21
-
22
-
23
-
24
-
25
-
26
-
27
-
28
-
29
-
30
-
31
-
32
-
33
-
34
-
35
-
36
-
37
-
38
-
39
-
40
-
 41
41 -
 42
42 -
 43
43 -
 44
44 -
 45
45 -
 46
46 -
 47
47 -
 48
48 -
 49
49 -
 50
50 -
 51
51 -
 52
52 -
 53
53 -
 54
54 -
 55
55 -
 56
56 -
 57
57 -
 58
58 -
 59
59 -
 60
60 -
 61
61 -
62
-
63
-
64
-
65
-
66
-
67
-
68
-
69
-
70
-
71
-
72
-
73
-
74
-
75
-
76
-
77
-
78
-
79
-
80
-
81
-
82
-
83
-
84
-
85
-
86
-
87
-
88
-
89
-
90
-
91
-
92
-
93
-
94
-
95
-
96
-
97
-
98
-
99
-
100
-
101
-
102
-
103
-
104
-
105
-
106
-
107
-
108
-
109
-
110
-
111
-
112
-
113
-
114
-
115
-
116
-
117
-
118
-
119
-
120
-
121
-
122
-
123
-
124
-
125
-
126
-
127
-
128
-
129
-
130
-
131
-
132
-
133
-
134
-
135
-
136
-
137
-
138
-
139
-
140
-
141
-
142
-
143
-
144
-
145
-
146
-
147
-
148
-
149
-
150
-
151
-
152
-
153
-
154
-
155
-
156
-
157
-
158
-
159
-
160
-
161
-
162
-
163
-
164
-
165
-
166
-
167
-
168
-
169
-
170
-
171
-
172
-
173
-
174
-
175
-
176
-
177
-
178
-
179
-
180
-
181
-
182
-
183
-
184
-
185
-
186
-
187
-
188
-
189
-
190
-
191
-
192
-
193
-
194
-
195
-
196
-
197
-
198
-
199
-
200
-
201
-
202
-
203
-
204
-
205
-
206
-
207
-
208
-
209
-
210
-
211
-
212
-
213
-
214
-
215
-
216
-
217
-
218
-
219
-
220
-
221
-
222
-
223
-
224
 |
 |

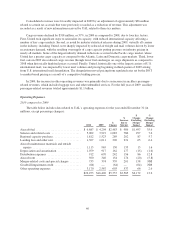
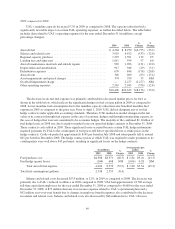
2009 compared to 2008
UAL’s mainline capacity decreased 9.7% in 2009 as compared to 2008. The capacity reduction had a
significantly favorable impact on certain UAL operating expenses, as further described below. The table below
includes data related to UAL’s operating expenses for the year ended December 31 (in millions, except
percentage changes):
2009 2008
$
Change
%
Change
Aircraft fuel ................................................ $ 4,204 $ 8,979 $(4,775) (53.2)
Salaries and related costs ...................................... 3,919 4,452 (533) (12.0)
Regional capacity purchase .................................... 1,523 1,391 132 9.5
Landing fees and other rent .................................... 1,011 954 57 6.0
Aircraft maintenance materials and outside repairs ................. 965 1,096 (131) (12.0)
Depreciation and amortization .................................. 917 946 (29) (3.1)
Distribution expenses ........................................ 670 846 (176) (20.8)
Aircraft rent ................................................ 346 409 (63) (15.4)
Asset impairments and special charges ........................... 374 339 35 NM
Goodwill impairment charge ................................... — 2,277 (2,277) NM
Other operating expenses ...................................... 2,567 2,943 (376) (12.8)
$16,496 $24,632 $(8,136) (33.0)
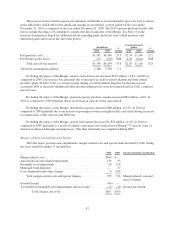
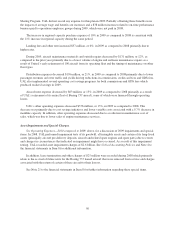
The decrease in aircraft fuel expense was primarily attributable to decreased market prices for fuel, as
shown in the table below, which reflects the significant changes in fuel cost per gallon in 2009 as compared to
2008. Lower mainline fuel consumption due to the mainline capacity reductions also benefited mainline fuel
expense in 2009 as compared to the prior year. Prior to April 1, 2010, UAL did not designate any of its fuel
hedge contracts under applicable accounting standards. Therefore, UAL marked-to-market changes in the fair
value of its contracts through fuel expense in the case of economic hedges and through nonoperating expense in
the case of hedges that were not considered to be economic hedges. The majority of the combined $1.1 billion of
fuel hedge losses in 2008 was due to mark-to-market losses on open fuel hedge contracts at December 31, 2008.
These contracts cash settled in 2009. These significant losses occurred because certain UAL hedge instruments
required payments by UAL to the counterparty if fuel prices fell below specified floors or strike prices in the
hedge contracts. Crude oil peaked at approximately $145 per barrel in July 2008 and subsequently fell to around
$45 per barrel in December 2008. The hedge contract prices at which UAL was required to make payments to its
counterparties were well above $45 per barrel, resulting in significant losses on the hedge contracts.
(In millions) %
Change
Average price per
gallon %
Change2009 2008 2009 2008
Fuel purchase cost ................................. $4,308 $8,371 (48.5) $ 1.84 $3.26 (43.5)
Fuel hedge (gains) losses ........................... (104) 608 NM (0.04) 0.28 NM
Total aircraft fuel expense ...................... 4,204 8,979 (53.2) $ 1.80 $3.54 (49.2)
Total fuel consumption (gallons) ..................... 2,338 2,553 (8.4)
Salaries and related costs decreased $533 million, or 12%, in 2009 as compared to 2008. The decrease was
primarily due to UAL’s reduced workforce in 2009 compared to 2008. UAL had approximately 43,700 average
full-time equivalent employees for the year ended December 31, 2009 as compared to 49,600 for the year ended
December 31, 2008. A $73 million decrease in severance expense related to UAL’s operational plans and a
$92 million year-over-year benefit due to changes in employee benefit expenses also contributed to the decrease
in salaries and related costs. Salaries and related costs also decreased by $46 million due to UAL’s Success
49