United Airlines 2010 Annual Report Download - page 92
Download and view the complete annual report
Please find page 92 of the 2010 United Airlines annual report below. You can navigate through the pages in the report by either clicking on the pages listed below, or by using the keyword search tool below to find specific information within the annual report.-
 1
1 -
2
-
3
-
4
-
5
-
6
-
7
-
8
-
9
-
10
-
11
-
12
-
13
-
14
-
15
-
16
-
17
-
18
-
19
-
20
-
21
-
22
-
23
-
24
-
25
-
26
-
27
-
28
-
29
-
30
-
31
-
32
-
33
-
34
-
35
-
36
-
37
-
38
-
39
-
40
-
41
-
42
-
43
-
44
-
45
-
46
-
47
-
48
-
49
-
50
-
51
-
52
-
53
-
54
-
55
-
56
-
57
-
58
-
59
-
60
-
61
-
62
-
63
-
64
-
65
-
66
-
67
-
68
-
69
-
70
-
71
-
72
-
73
-
74
-
75
-
76
-
77
-
78
-
79
-
80
-
81
-
 82
82 -
 83
83 -
 84
84 -
 85
85 -
 86
86 -
 87
87 -
 88
88 -
 89
89 -
 90
90 -
 91
91 -
 92
92 -
 93
93 -
 94
94 -
 95
95 -
 96
96 -
 97
97 -
 98
98 -
 99
99 -
 100
100 -
 101
101 -
 102
102 -
103
-
104
-
105
-
106
-
107
-
108
-
109
-
110
-
111
-
112
-
113
-
114
-
115
-
116
-
117
-
118
-
119
-
120
-
121
-
122
-
123
-
124
-
125
-
126
-
127
-
128
-
129
-
130
-
131
-
132
-
133
-
134
-
135
-
136
-
137
-
138
-
139
-
140
-
141
-
142
-
143
-
144
-
145
-
146
-
147
-
148
-
149
-
150
-
151
-
152
-
153
-
154
-
155
-
156
-
157
-
158
-
159
-
160
-
161
-
162
-
163
-
164
-
165
-
166
-
167
-
168
-
169
-
170
-
171
-
172
-
173
-
174
-
175
-
176
-
177
-
178
-
179
-
180
-
181
-
182
-
183
-
184
-
185
-
186
-
187
-
188
-
189
-
190
-
191
-
192
-
193
-
194
-
195
-
196
-
197
-
198
-
199
-
200
-
201
-
202
-
203
-
204
-
205
-
206
-
207
-
208
-
209
-
210
-
211
-
212
-
213
-
214
-
215
-
216
-
217
-
218
-
219
-
220
-
221
-
222
-
223
-
224
 |
 |

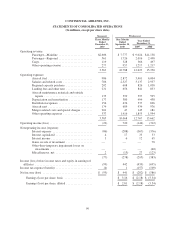
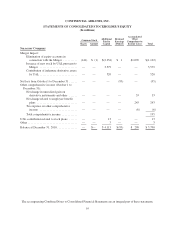
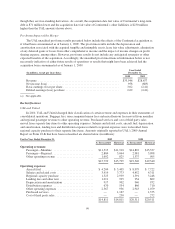
CONTINENTAL AIRLINES, INC.
STATEMENTS OF CONSOLIDATED OPERATIONS
(In millions, except per share data)
Successor Predecessor
Three Months
Ended
December 31,
2010
Nine Months
Ended
September 30,
2010
Year Ended
December 31,
2009 2008
Operating revenue:
Passenger—Mainline ....................... $2,606 $ 7,777 $ 9,024 $11,138
Passenger—Regional ....................... 561 1,726 2,016 2,498
Cargo ................................... 119 328 366 497
Other operating revenue ..................... 277 957 1,217 1,217
3,563 10,788 12,623 15,350
Operating expenses:
Aircraft fuel .............................. 986 2,872 3,401 6,004
Salaries and related costs .................... 786 2,527 3,137 2,957
Regional capacity purchase .................. 202 608 826 1,038
Landing fees and other rent .................. 231 656 841 853
Aircraft maintenance materials and outside
repairs ................................. 135 399 597 595
Depreciation and amortization ................ 177 380 494 438
Distribution expenses ....................... 156 474 537 626
Aircraft rent .............................. 174 689 934 976
Merger-related costs and special charges ........ 201 47 145 181
Other operating expenses .................... 537 1,416 1,855 1,994
3,585 10,068 12,767 15,662
Operating income (loss) ............................. (22) 720 (144) (312)
Nonoperating income (expense):
Interest expense ........................... (86) (288) (367) (376)
Interest capitalized ......................... 4 17 33 33
Interest income ............................ 3 6 12 65
Gains on sale of investment .................. — — — 78
Other-than-temporary impairment losses on
investments ............................. — — — (60)
Miscellaneous, net ......................... 2 (13) 27 (123)
(77) (278) (295) (383)
Income (loss) before income taxes and equity in earnings of
affiliates ....................................... (99) 442 (439) (695)
Income tax expense (benefit) ......................... (4) 1 (157) (109)
Net income (loss) .................................. $ (95) $ 441 $ (282) $ (586)
Earnings (loss) per share, basic ................... $ 3.16 $ (2.18) $ (5.54)
Earnings (loss) per share, diluted .................. $ 2.81 $ (2.18) (5.54)
90