United Airlines 2010 Annual Report Download - page 120
Download and view the complete annual report
Please find page 120 of the 2010 United Airlines annual report below. You can navigate through the pages in the report by either clicking on the pages listed below, or by using the keyword search tool below to find specific information within the annual report.-
 1
1 -
2
-
3
-
4
-
5
-
6
-
7
-
8
-
9
-
10
-
11
-
12
-
13
-
14
-
15
-
16
-
17
-
18
-
19
-
20
-
21
-
22
-
23
-
24
-
25
-
26
-
27
-
28
-
29
-
30
-
31
-
32
-
33
-
34
-
35
-
36
-
37
-
38
-
39
-
40
-
41
-
42
-
43
-
44
-
45
-
46
-
47
-
48
-
49
-
50
-
51
-
52
-
53
-
54
-
55
-
56
-
57
-
58
-
59
-
60
-
61
-
62
-
63
-
64
-
65
-
66
-
67
-
68
-
69
-
70
-
71
-
72
-
73
-
74
-
75
-
76
-
77
-
78
-
79
-
80
-
81
-
82
-
83
-
84
-
85
-
86
-
87
-
88
-
89
-
90
-
91
-
92
-
93
-
94
-
95
-
96
-
97
-
98
-
99
-
100
-
101
-
102
-
103
-
104
-
105
-
106
-
107
-
108
-
109
-
 110
110 -
 111
111 -
 112
112 -
 113
113 -
 114
114 -
 115
115 -
 116
116 -
 117
117 -
 118
118 -
 119
119 -
 120
120 -
 121
121 -
 122
122 -
 123
123 -
 124
124 -
 125
125 -
 126
126 -
 127
127 -
 128
128 -
 129
129 -
 130
130 -
131
-
132
-
133
-
134
-
135
-
136
-
137
-
138
-
139
-
140
-
141
-
142
-
143
-
144
-
145
-
146
-
147
-
148
-
149
-
150
-
151
-
152
-
153
-
154
-
155
-
156
-
157
-
158
-
159
-
160
-
161
-
162
-
163
-
164
-
165
-
166
-
167
-
168
-
169
-
170
-
171
-
172
-
173
-
174
-
175
-
176
-
177
-
178
-
179
-
180
-
181
-
182
-
183
-
184
-
185
-
186
-
187
-
188
-
189
-
190
-
191
-
192
-
193
-
194
-
195
-
196
-
197
-
198
-
199
-
200
-
201
-
202
-
203
-
204
-
205
-
206
-
207
-
208
-
209
-
210
-
211
-
212
-
213
-
214
-
215
-
216
-
217
-
218
-
219
-
220
-
221
-
222
-
223
-
224
 |
 |

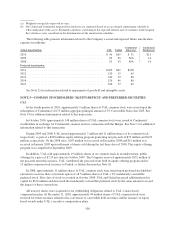
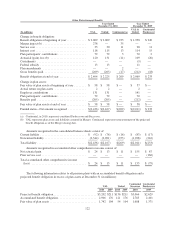
(In millions)
Year Ended December 31, 2008 UAL United
Continental
Successor
Continental
Predecessor
Income tax provision at statutory rate ........................ $(1,896) $(1,882) $(243)
State income taxes, net of federal income tax benefit ............ (68) (67) (14)
Goodwill .............................................. 798 798 —
Nondeductible employee meals ............................ 7 7 5
Nondeductible interest expense ............................. 10 10 —
Medicare Part D Subsidy .................................. (12) (12) —
Increase valuation allowance .............................. 1,117 1,101 142
Rate change beginning deferreds ........................... 14 14 —
Other, net .............................................. 5 9 1
$ (25) $ (22) $(109)
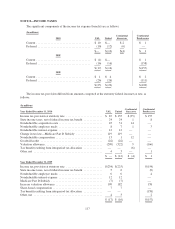
We are required to consider all items (including items recorded in other comprehensive income) in
determining the amount of tax benefit that should be allocated to a loss from continuing operations. As a result,
Continental recorded $6 million and $158 million of non-cash tax benefits on its loss from continuing operations
for the three months ended December 31, 2010 and the year ended December 31, 2009, respectively, which is
exactly offset by income tax expense in other comprehensive income, a component of stockholder’s
equity. Because the income tax expense on other comprehensive income is equal to the income tax benefit from
continuing operations, Continental’s net deferred tax positions at December 31, 2010 and 2009 were not
impacted by this tax allocation.
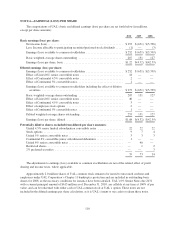
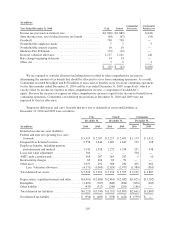
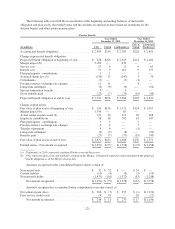
Temporary differences and carry forwards that give rise to deferred tax assets and liabilities at
December 31, 2010 and 2009 were as follows:
UAL United Continental
December 31, December 31, December 31,
(In millions) 2010 2009 2010 2009
Successor
2010
Predecessor
2009
Deferred income tax asset (liability):
Federal and state net operating loss carry-
forwards ............................... $3,429 $ 2,707 $ 2,217 $ 2,697 $ 1,179 $ 1,412
Frequent flyer deferred revenue ............... 2,358 1,644 1,609 1,647 752 128
Employee benefits, including pension,
postretirement and medical ................ 1,741 1,328 1,272 1,358 551 438
Lease fair value adjustment .................. 504 — — — 504 —
AMT credit carryforwards ................... 268 287 263 287 5 10
Restructuring charges ...................... 69 104 69 99 — —
Other asset ............................... 1,031 291 388 284 495 462
Less: Valuation allowance ............... (4,171) (3,060) (2,624) (2,977) (1,384) (563)
Total deferred tax assets .................... $5,229 $ 3,301 $ 3,194 $ 3,395 $ 2,102 $ 1,887
Depreciation, capitalized interest and other ...... $(4,091) $(2,686) $(2,463) $(2,682) $(1,625) $(1,702)
Intangibles ............................... (1,699) (787) (849) (834) (850) (185)
Other liability ............................. (433) (317) (240) (291) (186) —
Total deferred tax liabilities .................. $(6,223) $(3,790) $(3,552) $(3,807) $(2,661) $(1,887)
Net deferred tax liability .................... $ (994) $ (489) $ (358) $ (412) $ (559) $ —
118