United Airlines 2010 Annual Report Download - page 117
Download and view the complete annual report
Please find page 117 of the 2010 United Airlines annual report below. You can navigate through the pages in the report by either clicking on the pages listed below, or by using the keyword search tool below to find specific information within the annual report.-
 1
1 -
2
-
3
-
4
-
5
-
6
-
7
-
8
-
9
-
10
-
11
-
12
-
13
-
14
-
15
-
16
-
17
-
18
-
19
-
20
-
21
-
22
-
23
-
24
-
25
-
26
-
27
-
28
-
29
-
30
-
31
-
32
-
33
-
34
-
35
-
36
-
37
-
38
-
39
-
40
-
41
-
42
-
43
-
44
-
45
-
46
-
47
-
48
-
49
-
50
-
51
-
52
-
53
-
54
-
55
-
56
-
57
-
58
-
59
-
60
-
61
-
62
-
63
-
64
-
65
-
66
-
67
-
68
-
69
-
70
-
71
-
72
-
73
-
74
-
75
-
76
-
77
-
78
-
79
-
80
-
81
-
82
-
83
-
84
-
85
-
86
-
87
-
88
-
89
-
90
-
91
-
92
-
93
-
94
-
95
-
96
-
97
-
98
-
99
-
100
-
101
-
102
-
103
-
104
-
105
-
106
-
 107
107 -
 108
108 -
 109
109 -
 110
110 -
 111
111 -
 112
112 -
 113
113 -
 114
114 -
 115
115 -
 116
116 -
 117
117 -
 118
118 -
 119
119 -
 120
120 -
 121
121 -
 122
122 -
 123
123 -
 124
124 -
 125
125 -
 126
126 -
 127
127 -
128
-
129
-
130
-
131
-
132
-
133
-
134
-
135
-
136
-
137
-
138
-
139
-
140
-
141
-
142
-
143
-
144
-
145
-
146
-
147
-
148
-
149
-
150
-
151
-
152
-
153
-
154
-
155
-
156
-
157
-
158
-
159
-
160
-
161
-
162
-
163
-
164
-
165
-
166
-
167
-
168
-
169
-
170
-
171
-
172
-
173
-
174
-
175
-
176
-
177
-
178
-
179
-
180
-
181
-
182
-
183
-
184
-
185
-
186
-
187
-
188
-
189
-
190
-
191
-
192
-
193
-
194
-
195
-
196
-
197
-
198
-
199
-
200
-
201
-
202
-
203
-
204
-
205
-
206
-
207
-
208
-
209
-
210
-
211
-
212
-
213
-
214
-
215
-
216
-
217
-
218
-
219
-
220
-
221
-
222
-
223
-
224
 |
 |

Continental Predecessor
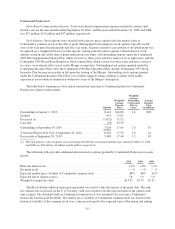
Stock-Based Compensation Expense. Total stock-based compensation expense included in salaries and
related costs for the nine months ended September 30, 2010, and the years ended December 31, 2009 and 2008
was $57 million, $(3) million and $47 million, respectively.
Stock Options. Stock options were awarded with exercise prices equal to the fair market value of
Continental’s common stock on the date of grant. Management level employee stock options typically vested
over a four year period and generally had five year terms. Expense related to each portion of an option grant was
recognized on a straight-line basis over the specific vesting period for those options. Outside director stock
options vested in full on the date of grant and had ten year terms. All outstanding options under the Continental
2005 Pilot Supplemental Option Plan, which vested over three years and have terms of six to eight years, and the
Continental 2005 Broad Based Employee Stock Option Plan, which vested over three years and have a term of
six years, were already fully vested on the Merger closing date. Outstanding stock options granted under the
Continental Incentive Plan 2000, the Continental 1998 Stock Incentive Plan, and the Continental 1997 Stock
Incentive Plan became exercisable in full upon the closing of the Merger. Outstanding stock options granted
under the Continental Incentive Plan 2010 vest on their original vesting schedule or earlier if the holder
experiences an involuntary termination within two years of the Merger closing date.
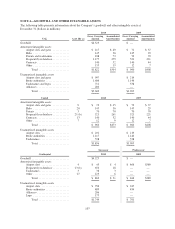
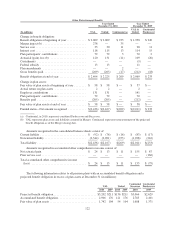
The table below summarizes stock option transactions pursuant to Continental plans for Continental
Predecessor (shares in thousands):
Options
Weighted-
Average
Exercise
Price
Weighted
Average
Remaining
Contractual
Life (in
years)
Average
Intrinsic
Value
(in millions)
Outstanding at January 1, 2010 ............................. 8,114 $16.08 2.4 $38
Granted ............................................... 654 23.83
Exercised (a) ........................................... (1,652) 11.92
Canceled .............................................. (92) 29.59
Outstanding at September 30, 2010 ......................... 7,024 17.60 2.0 61
Vested and Expected to Vest at September 30, 2010 ............ 6,943 17.59 2.0 61
Exercisable at September 30, 2010 .......................... 5,448 17.46 1.5 49
(a) The total intrinsic value of options exercised during 2010 Predecessor period and the years ended December 31, 2009
and 2008 was $18 million, $2 million and $3 million, respectively.
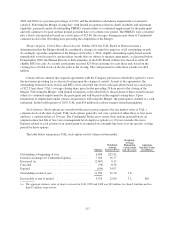
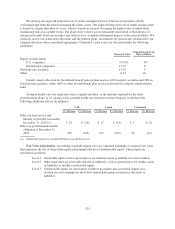
The following table provides additional information for options granted by Continental Predecessor in each
period.
2010 2009 2008
Risk-free interest rate ................................................... 1.4% 2.0% 3.1%
Dividend yield ........................................................ — % — % — %
Expected market price volatility of Continental common stock .................. 88% 86% 62%
Expected life of options (years) ........................................... 3.8 3.9 3.9
Weighted average fair value .............................................. $14.55 $5.75 $5.32
The Black-Scholes-Merton option-pricing model was used to value the options at the grant date. The risk-
free interest rate was based on the U.S. Treasury yield curve in effect for the expected term of the option at the
time of grant. The dividend yield on Continental common stock was assumed to be zero since Continental
historically had not paid dividends. The market price volatility of Continental common stock was based on the
historical volatility of the common stock over a time period equal to the expected term of the option and ending
115