United Airlines 2010 Annual Report Download - page 65
Download and view the complete annual report
Please find page 65 of the 2010 United Airlines annual report below. You can navigate through the pages in the report by either clicking on the pages listed below, or by using the keyword search tool below to find specific information within the annual report.-
 1
1 -
2
-
3
-
4
-
5
-
6
-
7
-
8
-
9
-
10
-
11
-
12
-
13
-
14
-
15
-
16
-
17
-
18
-
19
-
20
-
21
-
22
-
23
-
24
-
25
-
26
-
27
-
28
-
29
-
30
-
31
-
32
-
33
-
34
-
35
-
36
-
37
-
38
-
39
-
40
-
41
-
42
-
43
-
44
-
45
-
46
-
47
-
48
-
49
-
50
-
51
-
52
-
53
-
54
-
 55
55 -
 56
56 -
 57
57 -
 58
58 -
 59
59 -
 60
60 -
 61
61 -
 62
62 -
 63
63 -
 64
64 -
 65
65 -
 66
66 -
 67
67 -
 68
68 -
 69
69 -
 70
70 -
 71
71 -
 72
72 -
 73
73 -
 74
74 -
 75
75 -
76
-
77
-
78
-
79
-
80
-
81
-
82
-
83
-
84
-
85
-
86
-
87
-
88
-
89
-
90
-
91
-
92
-
93
-
94
-
95
-
96
-
97
-
98
-
99
-
100
-
101
-
102
-
103
-
104
-
105
-
106
-
107
-
108
-
109
-
110
-
111
-
112
-
113
-
114
-
115
-
116
-
117
-
118
-
119
-
120
-
121
-
122
-
123
-
124
-
125
-
126
-
127
-
128
-
129
-
130
-
131
-
132
-
133
-
134
-
135
-
136
-
137
-
138
-
139
-
140
-
141
-
142
-
143
-
144
-
145
-
146
-
147
-
148
-
149
-
150
-
151
-
152
-
153
-
154
-
155
-
156
-
157
-
158
-
159
-
160
-
161
-
162
-
163
-
164
-
165
-
166
-
167
-
168
-
169
-
170
-
171
-
172
-
173
-
174
-
175
-
176
-
177
-
178
-
179
-
180
-
181
-
182
-
183
-
184
-
185
-
186
-
187
-
188
-
189
-
190
-
191
-
192
-
193
-
194
-
195
-
196
-
197
-
198
-
199
-
200
-
201
-
202
-
203
-
204
-
205
-
206
-
207
-
208
-
209
-
210
-
211
-
212
-
213
-
214
-
215
-
216
-
217
-
218
-
219
-
220
-
221
-
222
-
223
-
224
 |
 |
based on its recent consortia participation, was approximately $212 million and $64 million, respectively. The
Company’s exposure could increase if the participation of other carriers decreases. The guarantees will expire
when the tax-exempt bonds are paid in full, which range from 2011 to 2040. The Company did not record a
liability at the time these indirect guarantees were made.
United and Continental—Cash Flow Activities—2010 Compared to 2009
United
Operating Activities
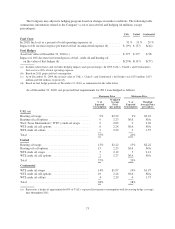
United’s cash from operating activities increased by $819 million in 2010, as compared to 2009. This year-
over-year increase was primarily due to increased cash from passenger and cargo services. Higher cash operating
expenses, including fuel, distribution costs and interest expense, partially offset the benefit from increased
revenues. Net cash required for fuel increased in the 2010 period due to higher aircraft fuel prices. Operating
cash flows in the 2009 period included the receipt of $160 million related to the future relocation of UAL’s
Chicago O’Hare cargo facility.
Investing Activities
United’s capital expenditures were $318 million and $317 million in 2010 and 2009, respectively. United
limited its spending in both 2010 and 2009 by focusing its capital resources only on its highest-value projects. In
2009, United received $175 million from three sale-leaseback agreements. These transactions were accounted for
as capital leases, resulting in an increase to capital lease assets and capital lease obligations during 2009.
Financing Activities
United’s significant financing activities in 2010 and 2009 are described in Cash Flows from Financing
Activities, above, in this Item 7.
Continental
Operating Activities
Continental’s cash from operating activities increased by $1.0 billion in the combined 2010 period, as
compared to 2009. This year-over-year increase was primarily due to increased cash from passenger and cargo
services. Higher cash operating expenses, including fuel and distribution costs, partially offset the benefit from
increased revenues.
Investing Activities
Continental’s capital expenditures were $300 million and $381 million in 2010 and 2009, respectively. In
addition, Continental acquired aircraft in both 2010 and 2009 with proceeds from financings that were delivered
directly to the manufacturer. See Note 18 to the financial statements in Item 8 for information related to these
non-cash financing and investing activities.
In the combined 2010 period, cash used for purchases of short-term investments was $273 million, as
compared to cash provided from sales of short-term investments of $180 million in 2009. This year-over-year
variance was primarily due to investment of higher cash balances.
Financing Activities
Significant financing activities in 2010 and 2009 included the following:
• In December 2010, Continental issued approximately $427 million of Class A and Class B pass-
through certificates through two pass-through trusts. See the discussion above in Cash Flows from
Financing Activities in this Item 7 for further information related to this financing.
63