United Airlines 2010 Annual Report Download - page 41
Download and view the complete annual report
Please find page 41 of the 2010 United Airlines annual report below. You can navigate through the pages in the report by either clicking on the pages listed below, or by using the keyword search tool below to find specific information within the annual report.-
 1
1 -
2
-
3
-
4
-
5
-
6
-
7
-
8
-
9
-
10
-
11
-
12
-
13
-
14
-
15
-
16
-
17
-
18
-
19
-
20
-
21
-
22
-
23
-
24
-
25
-
26
-
27
-
28
-
29
-
30
-
 31
31 -
 32
32 -
 33
33 -
 34
34 -
 35
35 -
 36
36 -
 37
37 -
 38
38 -
 39
39 -
 40
40 -
 41
41 -
 42
42 -
 43
43 -
 44
44 -
 45
45 -
 46
46 -
 47
47 -
 48
48 -
 49
49 -
 50
50 -
 51
51 -
52
-
53
-
54
-
55
-
56
-
57
-
58
-
59
-
60
-
61
-
62
-
63
-
64
-
65
-
66
-
67
-
68
-
69
-
70
-
71
-
72
-
73
-
74
-
75
-
76
-
77
-
78
-
79
-
80
-
81
-
82
-
83
-
84
-
85
-
86
-
87
-
88
-
89
-
90
-
91
-
92
-
93
-
94
-
95
-
96
-
97
-
98
-
99
-
100
-
101
-
102
-
103
-
104
-
105
-
106
-
107
-
108
-
109
-
110
-
111
-
112
-
113
-
114
-
115
-
116
-
117
-
118
-
119
-
120
-
121
-
122
-
123
-
124
-
125
-
126
-
127
-
128
-
129
-
130
-
131
-
132
-
133
-
134
-
135
-
136
-
137
-
138
-
139
-
140
-
141
-
142
-
143
-
144
-
145
-
146
-
147
-
148
-
149
-
150
-
151
-
152
-
153
-
154
-
155
-
156
-
157
-
158
-
159
-
160
-
161
-
162
-
163
-
164
-
165
-
166
-
167
-
168
-
169
-
170
-
171
-
172
-
173
-
174
-
175
-
176
-
177
-
178
-
179
-
180
-
181
-
182
-
183
-
184
-
185
-
186
-
187
-
188
-
189
-
190
-
191
-
192
-
193
-
194
-
195
-
196
-
197
-
198
-
199
-
200
-
201
-
202
-
203
-
204
-
205
-
206
-
207
-
208
-
209
-
210
-
211
-
212
-
213
-
214
-
215
-
216
-
217
-
218
-
219
-
220
-
221
-
222
-
223
-
224
 |
 |

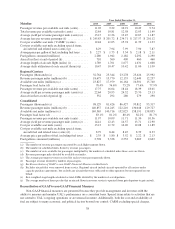
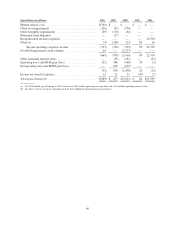
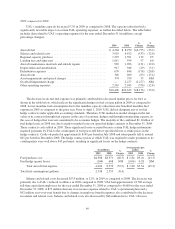
aircraft fuel and related taxes provides management and investors the ability to measure UAL’s cost performance
absent special items and fuel price volatility. Fuel hedge mark to market (“MTM”) gains (losses) are excluded as
UAL did not apply cash flow hedge accounting for many of the periods presented, and these adjustments provide a
better comparison to UAL’s peers, most of which apply cash flow hedge accounting. A reconciliation of GAAP to
Non-GAAP measures is provided below (in millions, except CASM amounts). Following this reconciliation is a
summary of special charges. For further information related to special charges, see Note 21 in Item 8 of this report.
2010 2009 2008 2007
Combined
2006
Net income (loss) excluding special items:
Net income (loss)—GAAP ........................ $ 253 $ (651) $ (5,396) $ 360 $ 22,858
Merger-related costs and special charges ............. 669 374 2,616 (89) (36)
Other operating expense items ..................... — 35 191 — 22
Operating non-cash MTM (gain) loss ............... 32 (586) 568 (20) 2
Non operating non-cash MTM (gain) loss ............ — (279) 279 — —
Income tax (benefit) expense ...................... (12) (21) (31) 47 7
Reorganization income ........................... ————(22,934)
Total special items—(income) expense .......... 689 (477) 3,623 (62) (22,939)
Net income (loss) excluding special items—non-GAAP $ 942 $ (1,128) $ (1,773) $ 298 $ (81)
Mainline cost per available seat mile excluding
special charges, aircraft fuel and related taxes:
Operating expenses—GAAP ...................... $ 18,131 $ 13,557 $ 21,384 $ 16,165 $ 16,069
Merger-related costs and special charges ............. (669) (374) (2,616) 44 36
Other operating income (expense) items ............. — (35) (191) — (22)
Operating non-cash MTM gain (loss) ............... (32) 586 (568) 20 (2)
Aircraft fuel and related taxes excluding non-cash
MTM ...................................... (5,355) (3,991) (7,154) (5,023) (4,822)
Operating expenses excluding above
items—non-GAAP ............................ $ 12,075 $ 9,743 $ 10,855 $ 11,206 $ 11,259
Available seat miles—mainline .................... 145,738 122,737 135,861 141,890 143,095
CASM—GAAP (cents) .......................... 12.44 11.05 15.74 11.39 11.23
CASM excluding special items, aircraft fuel and related
taxes-non-GAAP (cents) ....................... 8.29 7.94 7.99 7.90 7.87
Consolidated cost per available seat mile excluding
special charges, aircraft fuel and related taxes:
Operating expenses—GAAP ...................... $ 22,253 $ 16,496 $ 24,632 $ 19,106 $ 18,893
Merger-related costs and special charges ............. (669) (374) (2,616) 44 36
Other operating income (expense) items ............. — (35) (191) — (22)
Operating non-cash MTM gain (loss) ............... (32) 586 (568) 20 (2)
Aircraft fuel and related taxes excluding non-cash
MTM ...................................... (6,655) (4,790) (8,411) (5,895) (5,670)
Operating expenses excluding above
items—non-GAAP ............................ $ 14,897 $ 11,883 $ 12,846 $ 13,275 $ 13,235
Available seat miles—consolidated ................. 169,565 140,716 152,025 158,191 158,835
CASM—GAAP (cents) .......................... 13.12 11.72 16.20 12.08 11.89
CASM excluding special items, aircraft fuel and related
taxes- non-GAAP (cents) ....................... 8.79 8.44 8.45 8.39 8.33
39