United Airlines 2010 Annual Report Download - page 142
Download and view the complete annual report
Please find page 142 of the 2010 United Airlines annual report below. You can navigate through the pages in the report by either clicking on the pages listed below, or by using the keyword search tool below to find specific information within the annual report.-
 1
1 -
2
-
3
-
4
-
5
-
6
-
7
-
8
-
9
-
10
-
11
-
12
-
13
-
14
-
15
-
16
-
17
-
18
-
19
-
20
-
21
-
22
-
23
-
24
-
25
-
26
-
27
-
28
-
29
-
30
-
31
-
32
-
33
-
34
-
35
-
36
-
37
-
38
-
39
-
40
-
41
-
42
-
43
-
44
-
45
-
46
-
47
-
48
-
49
-
50
-
51
-
52
-
53
-
54
-
55
-
56
-
57
-
58
-
59
-
60
-
61
-
62
-
63
-
64
-
65
-
66
-
67
-
68
-
69
-
70
-
71
-
72
-
73
-
74
-
75
-
76
-
77
-
78
-
79
-
80
-
81
-
82
-
83
-
84
-
85
-
86
-
87
-
88
-
89
-
90
-
91
-
92
-
93
-
94
-
95
-
96
-
97
-
98
-
99
-
100
-
101
-
102
-
103
-
104
-
105
-
106
-
107
-
108
-
109
-
110
-
111
-
112
-
113
-
114
-
115
-
116
-
117
-
118
-
119
-
120
-
121
-
122
-
123
-
124
-
125
-
126
-
127
-
128
-
129
-
130
-
131
-
 132
132 -
 133
133 -
 134
134 -
 135
135 -
 136
136 -
 137
137 -
 138
138 -
 139
139 -
 140
140 -
 141
141 -
 142
142 -
 143
143 -
 144
144 -
 145
145 -
 146
146 -
 147
147 -
 148
148 -
 149
149 -
 150
150 -
 151
151 -
 152
152 -
153
-
154
-
155
-
156
-
157
-
158
-
159
-
160
-
161
-
162
-
163
-
164
-
165
-
166
-
167
-
168
-
169
-
170
-
171
-
172
-
173
-
174
-
175
-
176
-
177
-
178
-
179
-
180
-
181
-
182
-
183
-
184
-
185
-
186
-
187
-
188
-
189
-
190
-
191
-
192
-
193
-
194
-
195
-
196
-
197
-
198
-
199
-
200
-
201
-
202
-
203
-
204
-
205
-
206
-
207
-
208
-
209
-
210
-
211
-
212
-
213
-
214
-
215
-
216
-
217
-
218
-
219
-
220
-
221
-
222
-
223
-
224
 |
 |

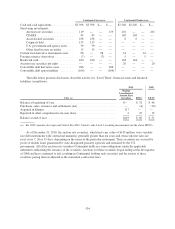
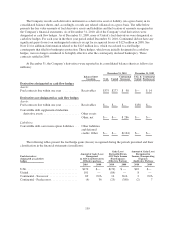
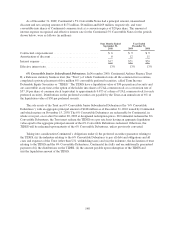
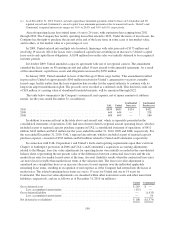
Derivatives not designated as cash
flow hedges Aircraft Fuel Gain (Loss)
Nonoperating Income
(Expense) Total Gain (Loss)
2010 2009 2008 2010 2009 2008 2010 2009 2008
Fuel:
UAL/United ....................... $(35) $104 $(608) $— $ 31 $(528) $(35) $135 $(1,136)
Convertible Debt Supplemental
Indenture Derivative Assets:
Continental Successor ................ $— $— $— $ 29 $— $— $29 $— $—
Convertible Debt Conversion Option
Liabilities:
Continental Successor ................ $— $— $— $(23) $— $ — $(23) $— $—
Foreign Currency Derivatives
The Company generates revenues and incurs expenses in numerous foreign currencies. Such expenses
include fuel, aircraft leases, commissions, catering, personnel expense, advertising and distribution costs,
customer service expense and aircraft maintenance. Changes in foreign currency exchange rates impact the
Company’s results of operations and cash flows through changes in the dollar value of foreign currency-
denominated operating revenues and expenses. When management believes risk reduction can be effectively
achieved, the Company may use foreign currency forward contracts to hedge a portion of its exposure to changes
in foreign currency exchange rates. The Company does not enter into foreign currency derivative contracts for
purposes other than risk management. As of December 31, 2010 and 2009, United did not have any foreign
currency derivatives. As of December 31, 2010 and 2009, Continental had foreign currency derivatives with fair
values of $7 million and $5 million, respectively. Hedge gains (losses) were not significant in any of the periods
presented in these financial statements.
Derivative Credit Risk and Fair Value
The Company is exposed to credit losses in the event of nonperformance by counterparties to its derivative
instruments. The Company enters into master netting agreements with its derivative counterparties. While the
Company records derivative instruments on a gross basis, the Company monitors its net derivative position with
each counterparty to monitor credit risk. As of December 31, 2010, United and Continental had net derivative
assets of $277 million and $98 million, respectively, with certain of their fuel derivative counterparties. Based on
the fair value of our fuel derivative instruments, our counterparties may require us to post collateral when the
price of the underlying commodity decreases, and we may require our counterparties to provide us with collateral
when the price of the underlying commodity increases. The Company was not required to post cash collateral
with any of its fuel derivative counterparties at December 31, 2010. United was required to post $10 million of
cash collateral with certain of its fuel derivative counterparties at December 31, 2009. Continental was not
required to post cash collateral with any of its fuel derivative counterparties at December 31, 2009. As of
December 31, 2010, United’s counterparties had provided cash collateral of $63 million, which United recorded
as an asset, in addition to an obligation to return the cash collateral. Therefore, United’s and Continental’s
potential credit-risk loss based on the value of the fuel derivatives as of December 31, 2010, if all counterparties
were to fail to perform collectively and simultaneously as of that date is $214 million and $98 million,
respectively.
The Company considers counterparty credit risk in determining its exposure and the fair value of its
financial instruments. The Company considers credit risk to have a minimal impact on fair value because cash
collateral is provided by the Company’s hedging counterparties periodically based on current market exposure
and the credit-worthiness of the counterparties.
140