SunTrust 2004 Annual Report Download - page 97
Download and view the complete annual report
Please find page 97 of the 2004 SunTrust annual report below. You can navigate through the pages in the report by either clicking on the pages listed below, or by using the keyword search tool below to find specific information within the annual report.-
 1
1 -
2
-
3
-
4
-
5
-
6
-
7
-
8
-
9
-
10
-
11
-
12
-
13
-
14
-
15
-
16
-
17
-
18
-
19
-
20
-
21
-
22
-
23
-
24
-
25
-
26
-
27
-
28
-
29
-
30
-
31
-
32
-
33
-
34
-
35
-
36
-
37
-
38
-
39
-
40
-
41
-
42
-
43
-
44
-
45
-
46
-
47
-
48
-
49
-
50
-
51
-
52
-
53
-
54
-
55
-
56
-
57
-
58
-
59
-
60
-
61
-
62
-
63
-
64
-
65
-
66
-
67
-
68
-
69
-
70
-
71
-
72
-
73
-
74
-
75
-
76
-
77
-
78
-
79
-
80
-
81
-
82
-
83
-
84
-
85
-
86
-
 87
87 -
 88
88 -
 89
89 -
 90
90 -
 91
91 -
 92
92 -
 93
93 -
 94
94 -
 95
95 -
 96
96 -
 97
97 -
 98
98 -
 99
99 -
 100
100 -
 101
101 -
 102
102 -
 103
103 -
 104
104 -
 105
105 -
 106
106 -
 107
107 -
108
-
109
-
110
-
111
-
112
-
113
-
114
-
115
-
116
 |
 |

NOTES TO CONSOLIDATED FINANCIAL STATEMENTS continued
SUNTRUST 2004 ANNUAL REPORT 95
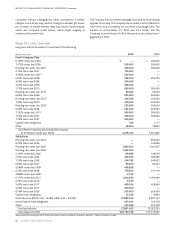
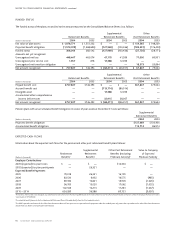
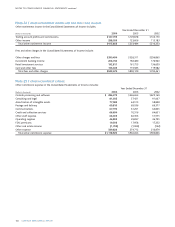
NET PERIODIC COST
Components of net periodic benefit cost were as follows:
Supplemental Other
Retirement Benefits Retirement Benefits Post Retirement Benefits
(Dollars in thousands) 2004 2003 2002 2004 2003 2002 2004 2003 2002
Service cost $ 50,085 $ 43,071 $ 42,530 $ 1,713 $ 1,520 $ 823 $ 2,277 $ 2,515 $ 4,146
Interest cost 82,084 74,574 69,067 5,082 4,991 4,995 9,803 10,823 11,052
Expected return on
plan assets (134,625) (111,656) (112,670) ———(8,606) (8,489) (8,218)
Amortization of prior
service cost (480) (443) (443) 1,992 1,941 2,201 ———
Recognized net
actuarial loss 37,910 57,307 16,657 4,751 4,358 3,180 5,554 6,840 3,372
Amortization of initial
transition obligation ————44 44 2,322 2,322 3,809
Net periodic benefit cost $ 34,974 $ 62,853 $ 15,141 $13,538 $12,854 $11,243 $11,350 $14,011 $14,161
Weighted-average
assumptions used to
determine net cost
Discount Rate16.25% 6.75% 7.25% 4.91% 6.75% 7.25% 6.25% 6.75% 7.25%
Expected return on
plan assets 8.50 8.75 9.50 N/A N/A N/A 6.00 6.25 7.00
Rate of compensation
increase 3.50 3.50 4.00 3.50 3.50 4.00 N/A N/A N/A
1The discount rate shown for 2004 reflects the rate used for the SunTrust Plans for fiscal 2004.The NCF Plans were measured for the period from October 1, 2004 through December 31, 2004 using a discount rate
of 5.75%.
Based on the investment policy for the Retirement Plan and the
other Post Retirement Benefit Plan, as well as an asset study that
was performed in 2003 and 2004 based on SunTrust’s asset alloca-
tions and future expectations, the expected rate of return on plan
assets was 8.50% in 2004.The asset study forecasted rates of return
for the approximate duration of SunTrust’s benefit obligations,
using capital market data and historical relationships. Based on this
study, SunTrust anticipates leaving the return on asset assumption
at 8.50% for 2005.
In addition, SunTrust sets pension asset values equal to their market
value, in contrast to the use of a smoothed asset value that incorpo-
rates gains and losses over a period of years.The poor economic
environment over the three years prior to 2003 may have led to
inflated asset values in cases where a smoothed asset value is used.
Utilization of market value of assets provides a more realistic eco-
nomic measure of the plan’s funded status and cost. Assumed dis-
count rates and expected returns on plan assets affect the amounts
of net periodic pension cost reported.A 25 basis points decrease in
the discount rate or expected long-term return on plan assets
would increase the net periodic pension cost approximately $9 mil-
lion and $4 million, respectively.
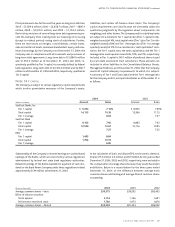
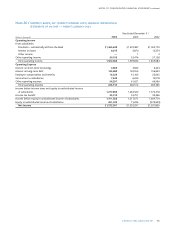
Assumed health care cost trend rates have a significant effect on
the amounts reported for the health care plan.A one-percentage-
point change in the assumed health care cost trend rates would
have had the following effect in fiscal 2004:
(Dollars in thousands) 1% Increase 1% Decrease
Effect on total of service and
interest cost $423 $(372)
Note 17 / DERIVATIVES AND OFF-BALANCE SHEET
ARRANGEMENTS
In the normal course of business, the Company utilizes various
financial instruments to meet the needs of customers and to man-
age the Company’s exposure to interest rate and other market risks.
These financial instruments, which consist of derivatives contracts
and credit-related arrangements, involve, to varying degrees,
elements of credit and market risk in excess of the amount recorded
on the balance sheet in accordance with generally accepted
accounting principles.
Credit risk represents the potential loss that may occur because a
party to a transaction fails to perform according to the terms of the
contract. Market risk is the possibility that a change in market prices
may cause the value of a financial instrument to decrease or
become more costly to settle.The contract/notional amounts of
financial instruments, which are not included in the Consolidated
Balance Sheets, do not necessarily represent credit or market risk.
However, they can be used to measure the extent of involvement in
various types of financial instruments.