SunTrust 2004 Annual Report Download - page 39
Download and view the complete annual report
Please find page 39 of the 2004 SunTrust annual report below. You can navigate through the pages in the report by either clicking on the pages listed below, or by using the keyword search tool below to find specific information within the annual report.-
 1
1 -
2
-
3
-
4
-
5
-
6
-
7
-
8
-
9
-
10
-
11
-
12
-
13
-
14
-
15
-
16
-
17
-
18
-
19
-
20
-
21
-
22
-
23
-
24
-
25
-
26
-
27
-
28
-
 29
29 -
 30
30 -
 31
31 -
 32
32 -
 33
33 -
 34
34 -
 35
35 -
 36
36 -
 37
37 -
 38
38 -
 39
39 -
 40
40 -
 41
41 -
 42
42 -
 43
43 -
 44
44 -
 45
45 -
 46
46 -
 47
47 -
 48
48 -
 49
49 -
50
-
51
-
52
-
53
-
54
-
55
-
56
-
57
-
58
-
59
-
60
-
61
-
62
-
63
-
64
-
65
-
66
-
67
-
68
-
69
-
70
-
71
-
72
-
73
-
74
-
75
-
76
-
77
-
78
-
79
-
80
-
81
-
82
-
83
-
84
-
85
-
86
-
87
-
88
-
89
-
90
-
91
-
92
-
93
-
94
-
95
-
96
-
97
-
98
-
99
-
100
-
101
-
102
-
103
-
104
-
105
-
106
-
107
-
108
-
109
-
110
-
111
-
112
-
113
-
114
-
115
-
116
 |
 |

MANAGEMENT’S DISCUSSION continued
SUNTRUST 2004 ANNUAL REPORT 37
Financial Statements. SunTrust is committed to remaining well
capitalized.
The Company issued approximately 76.4 million shares of SunTrust
common stock with an aggregate value of approximately $5.4 bil-
lion for the purchase of NCF.The remaining $1.8 billion of the pur-
chase price was funded with cash generated by a combination of
$800 million of wholesale CDs issued by SunTrust Bank in May
of 2004 and $1 billion of senior debt issued by the Company in
August of 2004.
In 2002, the Company raised $350 million of regulatory capital
through the sale of preferred shares issued by a real estate
investment trust subsidiary.This amount is reflected in other liabili-
ties and totaled $451.0 million and $412.5 million, including
accrued interest as of December 31, 2004 and December 31, 2003,
respectively.
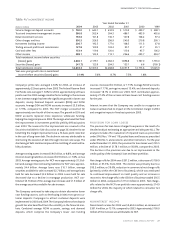
SunTrust manages capital through dividend and share repurchases
authorized by the Company’s Board of Directors. Management
assesses capital needs based on expected growth and the current
economic climate. In 2004, the Company repurchased 200,000
shares for $14.1 million compared to 3.3 million shares for $182.1
million repurchased in 2003. As of December 31, 2004, the
Company was authorized to purchase up to an additional 6.0 mil-
lion shares under current Board resolutions.
The Company declared common dividends totaling $603.3 million
during 2004, or $2.00 per share, on net income of $1,572.9 million.
The dividend payout ratio was 38.4% in 2004 versus 37.9% in 2003.
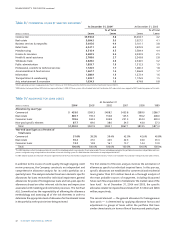
One measure of capital adequacy is the tangible equity ratio, which
is calculated using total shareholders’equity less purchase account-
ing intangibles, including goodwill, divided by total assets less pur-
chase accounting intangibles.This ratio was 5.67% as of December
31, 2004 versus 6.82% as of December 31, 2003. Management ana-
lyzes the Company’s capital position with and without the impact
of the stock of The Coca-Cola Company. As of December 31, 2004,
the amount in total shareholders’ equity related to this security
holding was $1.3 billion compared to $1.6 billion as of December
31, 2003.This decline accounted for 17 basis points of the 115 basis
points decline in the tangible equity ratio. The remainder of the
decline was attributed to the acquisition of NCF.
ENTERPRISE RISK MANAGEMENT
In the normal course of business, SunTrust is exposed to various
risks.To manage the major risks that are inherent to the Company
and to provide reasonable assurance that key business objectives
will be achieved, the Company has established an enterprise risk
governance process. Moreover, the Company has policies and vari-
ous risk management processes designed to effectively identify,
monitor, and manage risk.
Management continually refines and enhances its risk management
policies, processes, and procedures to maintain effective risk man-
agement and governance, including identification, measurement,
monitoring, control, mitigation, and reporting of all material risks.
Over the last few years, the Company has enhanced risk measure-
ment applications and systems capabilities that provide manage-
ment information on whether the Company is being appropriately
compensated for the risk profile it has adopted.The Company bal-
ances its strategic goals, including revenue and profitability objec-
tives, with the risks associated with achieving its goals. Effective risk
management is an important element supporting business decision
making at SunTrust.
The Company is currently implementing an enterprise risk manage-
ment framework that will improve the Company’s ability to manage
its aggregate risk profile.The Company’s Chief Risk Officer (CRO)
reports to the Chief Executive Officer and is responsible for the
oversight of the risk management organization as well as risk
governance processes.The CRO provides overall leadership, vision,
and direction for the Company’s enterprise risk management
framework.
Organizationally, the Company measures and manages risk accord-
ing to three main risk categories: credit risk, market risk (including
liquidity risk), and operating risk (including compliance risk).The
Chief Credit Officer manages the Company’s credit risk.The Chief
Financial Officer and Treasurer manage the Company’s market risk.
The Chief Operational Risk Officer manages the Company’s operat-
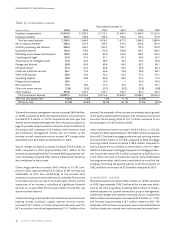
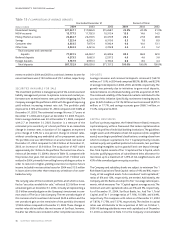
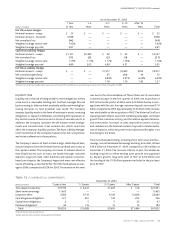
Table 14 / CAPITAL RATIOS
At December 31
(Dollars in millions) 2004 2003 2002 2001 2000 1999
Tier 1 capital1$ 9,783.7 $ 8,930.0 $ 8,106.1 $ 7,994.2 $ 6,850.6 $ 6,579.6
Total capital 14,152.6 13,365.9 12,609.8 12,144.2 10,488.9 9,939.1
Risk-weighted assets 136,642.8 113,711.3 108,501.1 99,700.9 96,656.7 87,866.1
Risk-based ratios
Tier 1 capital 7.16% 7.85% 7.47% 8.02% 7.09% 7.48%
Total capital 10.36 11.75 11.62 12.18 10.85 11.31
Tier 1 leverage ratio 6.64 7.37 7.30 7.94 6.98 7.17
Total shareholders’ equity to assets 10.06 7.76 7.47 7.98 7.95 8.00
1Tier 1 capital includes trust preferred obligations of $1.9 billion at the end of 2004, $1.7 billion at the end of 2003, 2002, and 2001, and $1.1 billion at the end of 2000 and 1999.
Tier 1 capital also includes preferred shares issued by a real estate investment trust subsidiary of $451 million at the end of 2004, 2003, and 2002, and $100 million at the end of 2001, and 2000.