SunTrust 2004 Annual Report Download - page 35
Download and view the complete annual report
Please find page 35 of the 2004 SunTrust annual report below. You can navigate through the pages in the report by either clicking on the pages listed below, or by using the keyword search tool below to find specific information within the annual report.-
 1
1 -
2
-
3
-
4
-
5
-
6
-
7
-
8
-
9
-
10
-
11
-
12
-
13
-
14
-
15
-
16
-
17
-
18
-
19
-
20
-
21
-
22
-
23
-
24
-
 25
25 -
 26
26 -
 27
27 -
 28
28 -
 29
29 -
 30
30 -
 31
31 -
 32
32 -
 33
33 -
 34
34 -
 35
35 -
 36
36 -
 37
37 -
 38
38 -
 39
39 -
 40
40 -
 41
41 -
 42
42 -
 43
43 -
 44
44 -
 45
45 -
46
-
47
-
48
-
49
-
50
-
51
-
52
-
53
-
54
-
55
-
56
-
57
-
58
-
59
-
60
-
61
-
62
-
63
-
64
-
65
-
66
-
67
-
68
-
69
-
70
-
71
-
72
-
73
-
74
-
75
-
76
-
77
-
78
-
79
-
80
-
81
-
82
-
83
-
84
-
85
-
86
-
87
-
88
-
89
-
90
-
91
-
92
-
93
-
94
-
95
-
96
-
97
-
98
-
99
-
100
-
101
-
102
-
103
-
104
-
105
-
106
-
107
-
108
-
109
-
110
-
111
-
112
-
113
-
114
-
115
-
116
 |
 |

MANAGEMENT’S DISCUSSION continued
SUNTRUST 2004 ANNUAL REPORT 33
The general allowance factors are determined using a baseline fac-
tor that is developed from an analysis of historical charge-off expe-
rience and expected losses, which are in turn based on estimated
probabilities of default and losses given default derived from an
internal risk rating process. These baseline factors are developed
and applied to the various loan pools. Adjustments are made to the
allowance for specific loan pools based on an assessment of internal
and external influences on credit quality that have not yet been
reflected in the historical loss or risk-rating data. These influences
may include elements such as changes in credit underwriting or
recent observable asset quality trends. Finally, our pool factors are
adjusted using a number of models which are intended to compen-
sate for internal and external portfolio and economic influences
that may not be captured in the adjusted baseline factors. The
Company continually evaluates its allowance methodology seeking
to refine and enhance this process as appropriate, and it is likely that
the methodology will evolve over time.
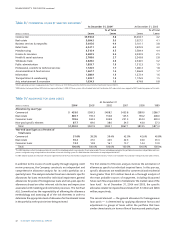
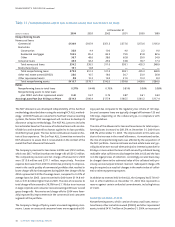
As of December 31, 2004 and 2003, the general allowance calcula-
tions totaled $920.8 million and $564.9 million, respectively. The
increase between the periods was due to enhancements to the gen-
eral allowance framework that resulted in more losses being identi-
fiable within the pool structure and by loan type. The increase also
resulted from the NCF acquisition.
The third element of the allowance is the non-pool-specific ele-
ment which addresses inherent losses that are not otherwise evalu-
ated in the first two elements.The qualitative factors of this third
allowance element are subjective and require a high degree of man-
agement judgment.These factors include the inherent imprecisions
in mathematical models and credit quality statistics, recent eco-
nomic uncertainty, losses incurred from recent events, and lagging
or incomplete data. As of December 31, 2004 and 2003, the
allowance estimated in the third element totaled $87.7 million
and $348.4 million, respectively.The change between the two peri-
ods was the result of enhancements to the general allowance ele-
ment designed to better define and allocate losses and allowances
to loan pools.
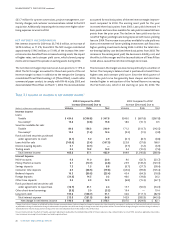
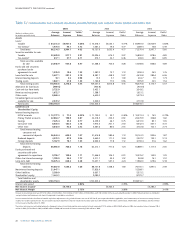
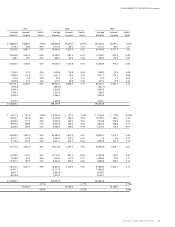
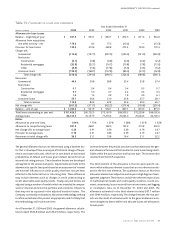
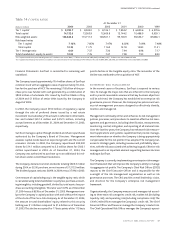
Table 10 / SUMMARY OF LOAN LOSS EXPERIENCE
Year Ended December 31
(Dollars in millions) 2004 2003 2002 2001 2000 1999
Allowance for Loan Losses
Balance – beginning of year $ 941.9 $ 930.1 $ 867.1 $ 874.5 $ 871.3 $ 944.6
Allowance from acquisitions
and other activity – net 173.8 9.3 15.5 (10.2) — (13.3)
Provision for loan losses 135.5 313.6 469.8 275.2 134.0 170.4
Charge-offs
Commercial (114.6) (197.7) (297.0) (220.0) (121.0) (220.9)
Real estate
Construction (4.1) (0.8) (0.8) (0.3) (0.2) (2.2)
Residential mortgages (32.8) (22.1) (16.7) (10.8) (7.8) (15.0)
Other (5.5) (5.6) (17.8) (5.9) (3.3) (5.2)
Consumer loans (159.0) (168.1) (157.8) (89.0) (57.5) (52.8)
Total charge-offs (316.0) (394.3) (490.1) (326.0) (189.8) (296.1)
Recoveries
Commercial 49.9 39.8 28.8 25.4 25.8 27.4
Real estate
Construction 0.1 0.4 0.4 0.4 0.3 0.7
Residential mortgages 9.7 5.0 3.7 2.2 3.3 3.4
Other 1.4 1.4 3.9 1.8 3.9 6.1
Consumer loans 53.7 36.6 31.0 23.8 25.7 28.1
Total recoveries 114.8 83.2 67.8 53.6 59.0 65.7
Net charge-offs (201.2) (311.1) (422.3) (272.4) (130.8) (230.4)
Balance – end of year $ 1,050.0 $ 941.9 $ 930.1 $ 867.1 $ 874.5 $ 871.3
Total loans outstanding at year end $101,426.2 $80,732.3 $73,167.9 $68,959.2 $72,239.8 $66,002.8
Average loans 86,214.5 76,137.9 71,270.4 70,023.0 70,044.3 62,749.4
Ratios
Allowance to year-end loans 1.04% 1.17% 1.27% 1.26% 1.21% 1.32%
Allowance to nonperforming loans 281.3 268.1 182.0 155.4 215.8 350.0
Net charge-offs to average loans 0.23 0.41 0.59 0.39 0.19 0.37
Provision to average loans 0.16 0.41 0.66 0.39 0.19 0.27
Recoveries to total charge-offs 36.3 21.1 13.8 16.4 31.1 22.2