SunTrust 2004 Annual Report Download - page 43
Download and view the complete annual report
Please find page 43 of the 2004 SunTrust annual report below. You can navigate through the pages in the report by either clicking on the pages listed below, or by using the keyword search tool below to find specific information within the annual report.-
 1
1 -
2
-
3
-
4
-
5
-
6
-
7
-
8
-
9
-
10
-
11
-
12
-
13
-
14
-
15
-
16
-
17
-
18
-
19
-
20
-
21
-
22
-
23
-
24
-
25
-
26
-
27
-
28
-
29
-
30
-
31
-
32
-
 33
33 -
 34
34 -
 35
35 -
 36
36 -
 37
37 -
 38
38 -
 39
39 -
 40
40 -
 41
41 -
 42
42 -
 43
43 -
 44
44 -
 45
45 -
 46
46 -
 47
47 -
 48
48 -
 49
49 -
 50
50 -
 51
51 -
 52
52 -
 53
53 -
54
-
55
-
56
-
57
-
58
-
59
-
60
-
61
-
62
-
63
-
64
-
65
-
66
-
67
-
68
-
69
-
70
-
71
-
72
-
73
-
74
-
75
-
76
-
77
-
78
-
79
-
80
-
81
-
82
-
83
-
84
-
85
-
86
-
87
-
88
-
89
-
90
-
91
-
92
-
93
-
94
-
95
-
96
-
97
-
98
-
99
-
100
-
101
-
102
-
103
-
104
-
105
-
106
-
107
-
108
-
109
-
110
-
111
-
112
-
113
-
114
-
115
-
116
 |
 |

MANAGEMENT’S DISCUSSION continued
SUNTRUST 2004 ANNUAL REPORT 41
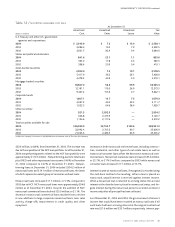
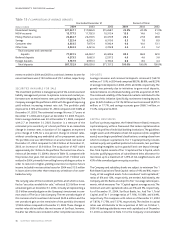
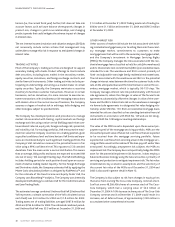
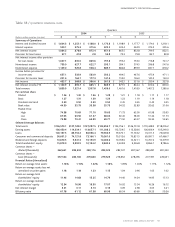
Table 15 / RISK MANAGEMENT DERIVATIVE FINANCIAL INSTRUMENTS1
The Company monitors its sensitivity to changes in interest rates
and may use derivative instruments to limit the volatility of net
interest income. Derivative instruments increased net interest
income in 2004 and 2003 by $151.5 million and $64.0 million,
respectively, or 13 basis points and six basis points, respectively.The
following tables summarize the derivative instruments entered into
by the Company as an end-user. See Note 17 for a complete descrip-
tion of the derivative instruments and activity for 2004 and 2003.
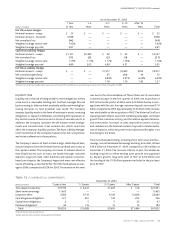
As of December 31, 2004
Gross Gross Average
Notional Unrealized Unrealized Maturity
(Dollars in millions) Amount Gains7Losses7Equity9in Years
Asset Hedges
Cash flow hedges
Interest rate swaps2$ 3,800 $ 1 $ (20) $(13) 2.39
Fair value hedges
Interest rate swaps370 1 — — 2.88
Forward contracts45,024 11 — — 0.06
Total asset hedges $ 8,894 $ 13 $ (20) $(13) 1.09
Liability Hedges
Cash flow hedges
Interest rate swaps5$ 6,015 $ 43 $ (13) $ 20 2.27
Fair value hedges
Interest rate swaps67,467 67 (106) — 8.26
Total liability hedges $13,482 $110 $(119) $ 20 5.58
Terminated/Dedesignated Liability Hedges
Cash flow hedges
Interest rate swaps8$ — $ — $ — $(14) 2.58
Total Terminated/Dedesignated hedges $ — $ — $ — $(14) 2.58
1Includes only derivative financial instruments which are currently, or were previously designated as, qualifying hedges under SFAS No. 149. All of the Company’s other derivative instruments are classified as
trading. All interest rate swaps have resets of three months or less, and are the pay and receive rates in effect at December 31, 2004.
2Represents interest rate swaps designated as cash flow hedges of commercial loans.
3Represents interest rate swaps designated as fair value hedges of fixed-rate loans and reverse repurchase agreements.
4Forward contracts are designated as fair value hedges of closed mortgage loans, including both fixed and floating, which are held for sale. Certain other forward contracts which are effective for risk manage-
ment purposes, but which are not in designated hedging relationships under SFAS No. 149, are not incorporated in this table.
5Represents interest rate swaps designated as cash flow hedges of floating rate certificates of deposit, Global Bank Notes, FHLB Advances and other variable rate debt.
6Represents interest rate swaps designated as fair value hedges of trust preferred securities, subordinated notes, FHLB Advances and other fixed rate debt.
7Represents the fair value of derivative financial instruments less accrued interest receivable or payable.
8Represents interest rate swaps that have been terminated or dedesignated as hedges under the provisions of SFAS No. 149. The $13.8 million of net losses, net of taxes recorded in accumulated other com-
prehensive income will be reclassified into earnings as a component of interest expense over the life of the originally hedged period, with the latest period being 2011.
9At December 31, 2004, the net unrealized loss on derivatives included in accumulated other comprehensive income, which is a component of stockholders’ equity, was $6.6 million, net of tax, that represents
the effective portion of the net gains and losses on derivatives that qualify as cashflow hedges. This includes an unrealized gain of $7.2 million on active hedges offset by a $13.8 million loss on terminat-
ed/dedesignated hedges. Gains or losses on hedges of interest rate risk will be classified into interest income or expense as a yield adjustment of the hedged item in the same period that the hedged cash
flows impact earnings. As of December 31, 2004, $12.1 million of net gains, net of taxes, recorded in accumulated other comprehensive income are expected to be reclassified as interest expense or interest
income during the next twelve months.
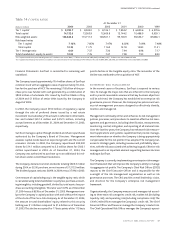
As of December 31, 2003
Gross Gross Average
Notional Unrealized Unrealized Maturity
(Dollars in millions) Amount Gains Losses Equity in Years
Asset Hedges
Fair value hedges
Interest rate swaps $ 25 $ — $ (1) $ — 0.82
Forward Contracts 3,938 — (43) — 0.07
Total asset hedges $3,963 $ — $(44) $ — 0.07
Liability Hedges
Cash flow hedges
Interest rate swaps $3,557 $ — $(27) $(17) 1.38
Fair value hedges
Interest rate swaps 5,917 126 (51) — 8.56
Total liability hedges $9,474 $126 $(78) $(17) 5.86