SunTrust 2004 Annual Report Download - page 28
Download and view the complete annual report
Please find page 28 of the 2004 SunTrust annual report below. You can navigate through the pages in the report by either clicking on the pages listed below, or by using the keyword search tool below to find specific information within the annual report.-
 1
1 -
2
-
3
-
4
-
5
-
6
-
7
-
8
-
9
-
10
-
11
-
12
-
13
-
14
-
15
-
16
-
17
-
 18
18 -
 19
19 -
 20
20 -
 21
21 -
 22
22 -
 23
23 -
 24
24 -
 25
25 -
 26
26 -
 27
27 -
 28
28 -
 29
29 -
 30
30 -
 31
31 -
 32
32 -
 33
33 -
 34
34 -
 35
35 -
 36
36 -
 37
37 -
 38
38 -
39
-
40
-
41
-
42
-
43
-
44
-
45
-
46
-
47
-
48
-
49
-
50
-
51
-
52
-
53
-
54
-
55
-
56
-
57
-
58
-
59
-
60
-
61
-
62
-
63
-
64
-
65
-
66
-
67
-
68
-
69
-
70
-
71
-
72
-
73
-
74
-
75
-
76
-
77
-
78
-
79
-
80
-
81
-
82
-
83
-
84
-
85
-
86
-
87
-
88
-
89
-
90
-
91
-
92
-
93
-
94
-
95
-
96
-
97
-
98
-
99
-
100
-
101
-
102
-
103
-
104
-
105
-
106
-
107
-
108
-
109
-
110
-
111
-
112
-
113
-
114
-
115
-
116
 |
 |

26 SUNTRUST 2004 ANNUAL REPORT
MANAGEMENT’S DISCUSSION continued
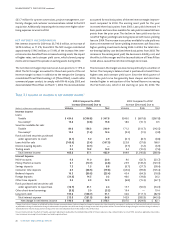
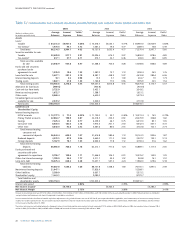
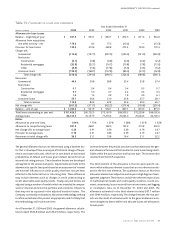
TABLE 3 / ANALYSIS OF CHANGES IN NET INTEREST INCOME1
2004 Compared to 2003 2003 Compared to 2002
Increase (Decrease) Due to Increase (Decrease) Due to
(Dollars in millions on a taxable-equivalent basis) Volume Rate Net Volume Rate Net
Interest Income
Loans:
Taxable $ 454.6 $(106.8) $ 347.8 $240.0 $ (607.8) $(367.8)
Tax-exempt214.6 (0.8) 13.8 18.6 (10.1) 8.5
Securities available for sale:
Taxable 84.6 156.3 240.9 171.2 (313.7) (142.5)
Tax-exempt215.0 (1.4) 13.6 (2.3) (1.5) (3.8)
Funds sold and securities purchased
under agreements to resell (0.1) 3.0 2.9 (0.1) (8.7) (8.8)
Loans held for sale (163.6) (3.4) (167.0) 225.8 (57.8) 168.0
Interest-bearing deposits 0.1 (0.1) — (5.7) (1.2) (6.9)
Trading assets 0.6 10.3 10.9 2.4 (10.0) (7.6)
Total interest income 405.8 57.1 462.9 649.9 (1,010.8) (360.9)
Interest Expense
NOW accounts 9.3 11.0 20.3 9.0 (32.7) (23.7)
Money Market accounts 6.1 (10.7) (4.6) 25.9 (149.2) (123.3)
Savings deposits 7.5 1.3 8.8 (0.7) (37.7) (38.4)
Consumer time deposits 8.9 (28.5) (19.6) (45.6) (99.8) (145.4)
Brokered deposits 16.5 (39.9) (23.4) 45.4 (64.3) (18.9)
Foreign deposits (14.3) 14.5 0.2 46.0 (19.8) 26.2
Other time deposits 9.0 3.9 12.9 (6.8) (15.3) (22.1)
Funds purchased and securities sold
under agreements to repurchase (18.7) 21.1 2.4 15.7 (50.0) (34.3)
Other short-term borrowings (8.3) 5.0 (3.3) 19.4 — 19.4
Long-term debt 199.8 (108.7) 91.1 34.6 (117.1) (82.5)
Total interest expense 215.8 (131.0) 84.8 142.9 (585.9) (443.0)
Net change in net interest income $ 190.0 $ 188.1 $ 378.1 $507.0 $ (424.9) $ 82.1
1Changes in net interest income are attributed to either changes in average balances (volume change) or changes in average rates (rate change) for earning assets and sources of funds on which interest is received
or paid.Volume change is calculated as change in volume times the previous rate,while rate change is change in rate times the previous volume.The rate/volume change, change in rate times change in volume, is
allocated between volume change and rate change at the ratio each component bears to the absolute value of their total.
2Interest income includes the effects of taxable-equivalent adjustments (reduced by the nondeductible portion of interest expense) using a federal income tax rate of 35% and, where applicable, state income
taxes to increase tax-exempt interest income to a taxable-equivalent basis.
$23.7 million for system conversions, project management, con-
formity changes, and customer communications related to the NCF
acquisition. Additionally impacting the increase were higher adver-
tising expenses incurred in 2004.
NET INTEREST INCOME/MARGIN
Net interest income for 2004 was $3,743.6 million, an increase of
$378.3 million, or 11.2%, from 2003.The NCF merger contributed
approximately $196.3 million, or 51.9%, of the increase. Net inter-
est income also benefited from increased earning assets, the impact
of higher rates, and a steeper yield curve, which slowed prepay-
ments and increased the spreads on earning assets during 2004.
The net interest margin improved seven basis points to 3.15% in
2004.The NCF merger accounted for three basis points of the net
interest margin increase. In addition to the merger, the Company
consolidated Three Pillars Funding, LLC (Three Pillars), a multi-seller
commercial paper conduit, to comply with FIN 46 in July 2003, and
deconsolidated Three Pillars on March 1, 2004.The deconsolidation
accounted for two basis points of the net interest margin improve-
ment compared to 2003. The earning asset yield for the year
increased three basis points from 2003. Loan yield decreased 14
basis points and securities available for sale yield increased 69 basis
points from the prior year. The decline in loan yield was due to
runoff of higher-yielding loans being replaced with lower-yielding
loans in 2004.The increase in securities available for sale yield was
due to reinvestment of lower-yielding investment cash flows into
higher-yielding investments during 2004. In 2004, the total inter-
est-bearing liability cost declined three basis points from 2003.The
increase in the earning asset yield, the decrease in liability cost, and
the effect of the merger and the deconsolidation of Three Pillars
noted above, caused the net interest margin to increase.
The increase in the margin was due more specifically to a number of
factors.The Company’s balance sheet is positioned to benefit from
higher rates and a steeper yield curve. Since the third quarter of
2003, the yield curve has generally been steeper and rates have
trended higher in anticipation of the Federal Reserve increasing
the Fed Funds rate, which it did starting on June 30, 2004. The