SunTrust 2004 Annual Report Download - page 20
Download and view the complete annual report
Please find page 20 of the 2004 SunTrust annual report below. You can navigate through the pages in the report by either clicking on the pages listed below, or by using the keyword search tool below to find specific information within the annual report.-
 1
1 -
2
-
3
-
4
-
5
-
6
-
7
-
8
-
9
-
 10
10 -
 11
11 -
 12
12 -
 13
13 -
 14
14 -
 15
15 -
 16
16 -
 17
17 -
 18
18 -
 19
19 -
 20
20 -
 21
21 -
 22
22 -
 23
23 -
 24
24 -
 25
25 -
 26
26 -
 27
27 -
 28
28 -
 29
29 -
 30
30 -
31
-
32
-
33
-
34
-
35
-
36
-
37
-
38
-
39
-
40
-
41
-
42
-
43
-
44
-
45
-
46
-
47
-
48
-
49
-
50
-
51
-
52
-
53
-
54
-
55
-
56
-
57
-
58
-
59
-
60
-
61
-
62
-
63
-
64
-
65
-
66
-
67
-
68
-
69
-
70
-
71
-
72
-
73
-
74
-
75
-
76
-
77
-
78
-
79
-
80
-
81
-
82
-
83
-
84
-
85
-
86
-
87
-
88
-
89
-
90
-
91
-
92
-
93
-
94
-
95
-
96
-
97
-
98
-
99
-
100
-
101
-
102
-
103
-
104
-
105
-
106
-
107
-
108
-
109
-
110
-
111
-
112
-
113
-
114
-
115
-
116
 |
 |

18 SUNTRUST 2004 ANNUAL REPORT
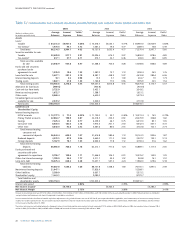
SELECTED FINANCIAL DATA
Year Ended December 31
(Dollars in millions except per share and other data) 2004 2003 2002 2001 2000 1999
Summary of Operations
Interest and dividend income $ 5,218.4 $ 4,768.8 $ 5,135.2 $ 6,279.6 $ 6,845.4 $ 5,960.2
Interest expense 1,533.2 1,448.5 1,891.5 3,027.0 3,736.9 2,814.7
Net interest income 3,685.2 3,320.3 3,243.7 3,252.6 3,108.5 3,145.5
Provision for loan losses 135.6 313.6 469.8 275.2 134.0 170.4
Net interest income after provision
for loan losses 3,549.6 3,006.7 2,773.9 2,977.4 2,974.5 2,975.1
Noninterest income 2,604.4 2,303.0 2,268.8 2,051.9 1,773.6 1,625.9
Noninterest expense 3,897.0 3,400.6 3,219.4 2,999.9 2,828.5 2,905.3
Income before provision for income taxes
and extraordinary gain 2,257.0 1,909.1 1,823.3 2,029.4 1,919.6 1,695.7
Provision for income taxes 684.1 576.8 491.5 653.9 625.5 571.7
Income before extraordinary gain 1,572.9 1,332.3 1,331.8 1,375.5 1,294.1 1,124.0
Extraordinary gain, net of taxes1—— — — — 202.6
Net income $ 1,572.9 $ 1,332.3 $ 1,331.8 $ 1,375.5 $ 1,294.1 $ 1,326.6
Net interest income-FTE $ 3,743.6 $ 3,365.3 $ 3,283.2 $ 3,293.4 $ 3,148.4 $ 3,188.0
Total revenue 6,348.0 5,668.3 5,552.0 5,345.3 4,922.0 4,813.9
Per common share
Diluted
Income before extraordinary gain $ 5.19 $ 4.73 $ 4.66 $ 4.72 $ 4.30 $ 3.50
Extraordinary gain —— — — — 0.63
Net income 5.19 4.73 4.66 4.72 4.30 4.13
Basic
Income before extraordinary gain 5.25 4.79 4.71 4.78 4.35 3.54
Extraordinary gain —— — — — 0.64
Net income 5.25 4.79 4.71 4.78 4.35 4.18
Dividends declared 2.00 1.80 1.72 1.60 1.48 1.38
Market price:
High 76.65 71.73 70.20 72.35 68.06 79.81
Low 61.27 51.44 51.48 57.29 41.63 60.44
Close 73.88 71.50 56.92 62.70 63.00 68.81
Selected Average Balances
Total assets $133,754.3 $122,325.4 $108,516.1 $102,884.2 $ 98,397.8 $92,820.8
Earning assets 118,905.6 109,257.4 96,370.8 92,034.1 88,609.0 82,255.7
Loans 86,214.5 76,137.9 71,270.4 70,023.0 70,044.3 62,749.4
Deposits 87,132.9 80,039.0 71,157.2 64,568.7 66,691.9 57,842.1
Total shareholders’ equity 11,469.5 9,083.0 8,725.7 8,073.8 7,501.9 8,190.7
At December 31
Total assets $158,869.8 $125,250.5 $117,322.5 $104,740.6 $103,660.4 $95,390.0
Earning assets 138,726.6 112,376.9 104,759.6 93,327.5 92,147.8 85,193.4
Loans 101,426.2 80,732.3 73,167.9 68,959.2 72,239.8 66,002.8
Allowance for loan losses 1,050.0 941.9 930.1 867.1 874.5 871.3
Deposits 103,361.3 81,189.5 79,706.6 67,536.4 69,533.3 60,100.5
Long-term debt 22,127.2 15,313.9 11,879.8 12,660.6 8,945.4 6,017.3
Total shareholders’ equity 15,986.9 9,731.2 8,769.5 8,359.6 8,239.2 7,626.9
Ratios and Other Data
Return on average total assets 1.18% 1.09% 1.23% 1.34% 1.32% 1.43%
Return on average assets less net unrealized
securities gains 1.19 1.01 1.10 1.24 1.31 1.52
Return on average total shareholders’ equity 13.71 14.67 15.26 17.04 17.25 16.20
Return on average realized shareholders’ equity 15.65 15.98 16.67 19.68 20.90 21.51
Net interest margin 3.15 3.08 3.41 3.58 3.55 3.88
Efficiency ratio 61.39 59.99 57.99 56.12 57.47 60.35
Total average shareholders’ equity to total
average assets 8.58 7.43 8.04 7.85 7.62 8.82
Allowance to year-end loans 1.04 1.17 1.27 1.26 1.21 1.32
Nonperforming assets to total loans plus
OREO and other repossessed assets 0.40 0.47 0.74 0.87 0.61 0.43
Common dividend payout ratio 38.4 37.9 36.8 33.7 34.3 33.4
Full-service banking offices 1,676 1,183 1,184 1,128 1,129 1,114
ATMs 2,804 2,225 2,286 1,944 1,991 1,968
Full-time equivalent employees 33,156 27,578 27,622 28,391 28,268 30,222
Average common shares – diluted (thousands) 303,309 281,434 286,052 291,584 300,956 321,174
Average common shares – basic (thousands) 299,375 278,295 282,495 287,702 297,834 317,079
1Represents the gain on the sale of the Company’s consumer credit card portfolio in 1999, net of $124.6 million in taxes.