SunTrust 2004 Annual Report Download - page 102
Download and view the complete annual report
Please find page 102 of the 2004 SunTrust annual report below. You can navigate through the pages in the report by either clicking on the pages listed below, or by using the keyword search tool below to find specific information within the annual report.-
 1
1 -
2
-
3
-
4
-
5
-
6
-
7
-
8
-
9
-
10
-
11
-
12
-
13
-
14
-
15
-
16
-
17
-
18
-
19
-
20
-
21
-
22
-
23
-
24
-
25
-
26
-
27
-
28
-
29
-
30
-
31
-
32
-
33
-
34
-
35
-
36
-
37
-
38
-
39
-
40
-
41
-
42
-
43
-
44
-
45
-
46
-
47
-
48
-
49
-
50
-
51
-
52
-
53
-
54
-
55
-
56
-
57
-
58
-
59
-
60
-
61
-
62
-
63
-
64
-
65
-
66
-
67
-
68
-
69
-
70
-
71
-
72
-
73
-
74
-
75
-
76
-
77
-
78
-
79
-
80
-
81
-
82
-
83
-
84
-
85
-
86
-
87
-
88
-
89
-
90
-
91
-
 92
92 -
 93
93 -
 94
94 -
 95
95 -
 96
96 -
 97
97 -
 98
98 -
 99
99 -
 100
100 -
 101
101 -
 102
102 -
 103
103 -
 104
104 -
 105
105 -
 106
106 -
 107
107 -
 108
108 -
 109
109 -
 110
110 -
 111
111 -
 112
112 -
113
-
114
-
115
-
116
 |
 |

100 SUNTRUST 2004 ANNUAL REPORT
NOTES TO CONSOLIDATED FINANCIAL STATEMENTS continued
the contract, the Company would make a cash payment to the
holder of credit protection and would take delivery of the refer-
enced asset from which the Company may recover a portion of the
credit loss.
Note 19 / CONCENTRATIONS OF CREDIT RISK
Credit risk refers to the potential for economic loss arising from the
failure of SunTrust customers to meet their contractual agreements
on all credit instruments, including on-balance sheet exposures
from loans, contingent exposures from unfunded commitments,
letters of credit, credit derivatives, and counterparty risk under
interest rate and foreign exchange derivative products. Concen-
trations of credit risk (whether on or off-balance sheet) arising from
financial instruments, can exist in relation to individual borrowers
or groups of borrowers, certain types of collateral, certain types of
industries, or certain regions of the country. Credit risk associated
with these concentrations could arise when a significant amount of
loans, related by similar characteristics, are simultaneously
impacted by changes in economic or other conditions that cause
their probability of repayment to be adversely affected. The
Company does not have a significant concentration to any individ-
ual client except for the U.S. government and its agencies.The major
concentrations of credit risk for the Company are related to collat-
eral type in relation to loans and credit commitments.The only sig-
nificant concentration in loans by collateral type that exists is in
loans secured by residential real estate. At December 31, 2004, the
Company had $36.1 billion in residential real estate loans, repre-
senting 35.6% of total loans, and an additional $12.1 billion in
commitments to extend credit on such loans. A geographic con-
centration arises because the Company operates primarily in the
Southeastern and Mid-Atlantic regions of the United States.
SunTrust engages in limited international banking activities.The
Company’s total cross-border outstandings were $573.0 million as
of December 31, 2004.
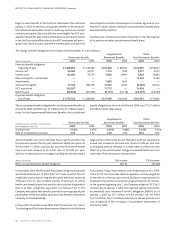
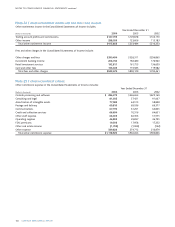
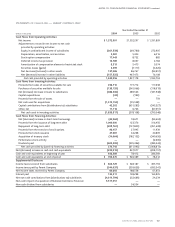
Note 20 / FAIR VALUES OF FINANCIAL INSTRUMENTS
The following table presents the carrying amounts and fair values of the Company’s financial instruments at December 31, 2004 and 2003:
2004 2003
Carrying Fair Carrying Fair
(Dollars in thousands) Amount Value Amount Value
Financial assets
Cash and short-term investments $ 5,488,939 $ 5,488,939 $ 5,321,374 $ 5,321,374
Trading assets 2,183,645 2,183,645 1,710,467 1,710,467
Securities available for sale 28,941,080 28,941,080 25,606,884 25,606,884
Loans held for sale 6,580,223 6,579,482 5,552,060 5,556,142
Loans 100,376,148 100,312,937 79,790,399 80,474,925
Mortgage servicing rights 482,392 631,518 449,293 560,628
Financial liabilities
Consumer and commercial deposits 92,109,695 92,132,281 72,924,646 73,058,073
Brokered deposits 6,100,911 6,101,412 3,184,084 3,195,497
Foreign deposits 5,150,645 5,150,645 5,080,789 5,080,789
Short-term borrowings 11,405,380 11,405,380 13,566,392 13,566,392
Long-term debt 22,127,166 22,837,503 15,313,922 16,018,678
Trading liabilities 1,098,563 1,098,563 1,020,142 1,020,142
The following methods and assumptions were used by the
Company in estimating the fair value of financial instruments:
• Short-term financial instruments are valued at their carrying
amounts reported in the balance sheet, which are reasonable esti-
mates of fair value due to the relatively short period to maturity
of the instruments.This approach applies to cash and cash equiva-
lents, short-term investments, short-term borrowings and certain
other assets and liabilities.
• Trading assets and liabilities are substantially valued at quoted
market prices. If quoted market prices are not available, fair values
are based on quoted market prices of comparable instruments.
Fair values for derivatives are based on quoted market prices,
current settlement values, pricing models or other formulas.
• Securities available for sale are substantially valued at quoted
market prices.
• Loans held for sale are valued based on quoted market prices in
the secondary market.
• Loans are valued on the basis of estimated future receipts of prin-
cipal and interest, discounted at rates currently being offered for
loans with similar terms and credit quality. Loan prepayments are
used to adjust future cash flows based on historical patterns.The
carrying amount of accrued interest approximates its fair value.