SunTrust 2004 Annual Report Download - page 30
Download and view the complete annual report
Please find page 30 of the 2004 SunTrust annual report below. You can navigate through the pages in the report by either clicking on the pages listed below, or by using the keyword search tool below to find specific information within the annual report.-
 1
1 -
2
-
3
-
4
-
5
-
6
-
7
-
8
-
9
-
10
-
11
-
12
-
13
-
14
-
15
-
16
-
17
-
18
-
19
-
 20
20 -
 21
21 -
 22
22 -
 23
23 -
 24
24 -
 25
25 -
 26
26 -
 27
27 -
 28
28 -
 29
29 -
 30
30 -
 31
31 -
 32
32 -
 33
33 -
 34
34 -
 35
35 -
 36
36 -
 37
37 -
 38
38 -
 39
39 -
 40
40 -
41
-
42
-
43
-
44
-
45
-
46
-
47
-
48
-
49
-
50
-
51
-
52
-
53
-
54
-
55
-
56
-
57
-
58
-
59
-
60
-
61
-
62
-
63
-
64
-
65
-
66
-
67
-
68
-
69
-
70
-
71
-
72
-
73
-
74
-
75
-
76
-
77
-
78
-
79
-
80
-
81
-
82
-
83
-
84
-
85
-
86
-
87
-
88
-
89
-
90
-
91
-
92
-
93
-
94
-
95
-
96
-
97
-
98
-
99
-
100
-
101
-
102
-
103
-
104
-
105
-
106
-
107
-
108
-
109
-
110
-
111
-
112
-
113
-
114
-
115
-
116
 |
 |

28 SUNTRUST 2004 ANNUAL REPORT
MANAGEMENT’S DISCUSSION continued
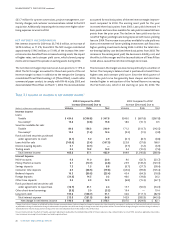
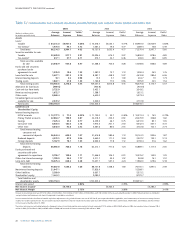
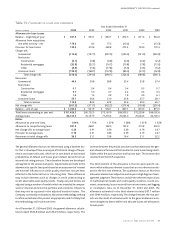
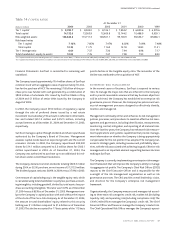
Table 5 / CONSOLIDATED DAILY AVERAGE BALANCES,INCOME/EXPENSE AND AVERAGE YIELDS EARNED AND RATES PAID
2004 2003 2002
(Dollars in millions; yields Average Income/ Yields/ Average Income/ Yields/ Average Income/ Yields/
on taxable-equivalent basis) Balances Expense Rates Balances Expense Rates Balances Expense Rates
Assets
Loans:1
Taxable $ 84,241.0 $3,901.0 4.63% $ 74,476.7 $3,553.1 4.77% $ 69,981.0 $3,920.9 5.60%
Tax-exempt21,973.5 93.1 4.72 1,661.2 79.3 4.77 1,289.4 70.8 5.49
Total loans 86,214.5 3,994.1 4.63 76,137.9 3,632.4 4.77 71,270.4 3,991.7 5.60
Securities available for sale:
Taxable 23,429.8 917.1 3.91 20,994.4 676.2 3.22 16,890.3 818.6 4.85
Tax-exempt2617.1 37.7 6.11 374.1 24.1 6.46 408.3 28.0 6.85
Total securities available
for sale 24,046.9 954.8 3.97 21,368.5 700.3 3.28 17,298.6 846.6 4.89
Funds sold and securities
purchased under
agreements to resell 1,376.9 18.6 1.35 1,387.0 15.7 1.13 1,390.4 24.5 1.76
Loans held for sale 5,427.1 281.3 5.18 8,587.7 448.3 5.22 4,410.8 280.4 6.36
Interest-bearing deposits 18.1 0.2 0.98 10.5 0.1 1.39 404.7 7.0 1.73
Trading assets 1,822.1 27.8 1.53 1,765.8 17.0 0.96 1,595.9 24.5 1.54
Total earning assets 118,905.6 5,276.8 4.44 109,257.4 4,813.8 4.41 96,370.8 5,174.7 5.37
Allowance for loan losses (989.5) (950.8) (924.3)
Cash and due from banks 3,732.9 3,432.1 3,343.2
Premises and equipment 1,672.7 1,588.7 1,621.2
Other assets 8,060.4 6,655.0 5,373.4
Unrealized gains on securities
available for sale 2,372.2 2,343.0 2,731.8
Total assets $133,754.3 $122,325.4 $108,516.1
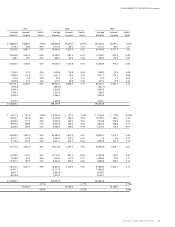
Liabilities and
Shareholders’ Equity
Interest-bearing deposits:
NOW accounts $ 13,777.5 $ 71.0 0.52% $ 11,702.0 $ 50.7 0.43% $ 10,315.4 $ 74.5 0.72%
Money Market accounts 22,864.7 198.9 0.87 22,218.5 203.5 0.92 20,470.9 326.8 1.60
Savings 7,225.4 55.5 0.77 6,259.3 46.7 0.75 6,310.0 85.1 1.35
Consumer time 8,333.5 182.0 2.18 7,975.4 201.7 2.53 9,342.4 347.1 3.72
Other time 3,843.3 92.8 2.42 3,461.6 80.0 2.31 3,722.8 102.1 2.74
Total interest-bearing
consumer and
commercial deposits 56,044.4 600.2 1.07 51,616.8 582.6 1.13 50,161.5 935.6 1.87
Brokered deposits 4,273.5 87.9 2.06 3,662.0 111.2 3.04 2,537.2 130.1 5.13
Foreign deposits 5,767.9 78.1 1.35 6,933.3 77.8 1.12 3,190.4 51.6 1.62
Total interest-bearing
deposits 66,085.8 766.2 1.16 62,212.1 771.6 1.24 55,889.1 1,117.3 2.00
Funds purchased and
securities sold under
agreements to repurchase 9,796.7 108.6 1.11 11,666.9 106.2 0.91 10,376.2 140.5 1.35
Other short-term borrowings 1,709.9 30.2 1.77 2,211.7 33.5 1.52 924.8 14.1 1.52
Long-term debt 18,075.4 628.2 3.48 12,657.1 537.2 4.24 11,960.0 619.6 5.18
Total interest-bearing
liabilities 95,667.8 1,533.2 1.60 88,747.8 1,448.5 1.63 79,150.1 1,891.5 2.39
Noninterest-bearing deposits 21,047.1 17,826.9 15,268.1
Other liabilities 5,569.9 6,667.7 5,372.2
Shareholders’ equity 11,469.5 9,083.0 8,725.7
Total liabilities and
shareholders’ equity $133,754.3 $122,325.4 $108,516.1
Interest rate spread 2.84% 2.78% 2.98%
Net Interest Income3$3,743.6 $3,365.3 $3,283.2
Net Interest Margin 3.15% 3.08% 3.41%
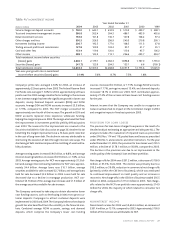
1Interest income includes loan fees of $121.6 million,$123.8 million, $122.6 million, $148.7 million, $135.6 million, and $142.3 million in the six years ended December 31, 2004. Nonaccrual loans are included in
average balances and income on such loans, if recognized, is recorded on a cash basis.
2Interest income includes the effects of taxable-equivalent adjustments using a federal income tax rate of 35% for all years reported and where applicable, state income taxes, to increase tax-exempt interest
income to a taxable-equivalent basis.The net taxable-equivalent adjustment amounts included in the above table were $58.4 million, $45.0 million, $39.5 million, $40.8 million, $39.9 million, and $42.5 million
in the six years ended December 31, 2004.
3Derivative instruments used to help balance the Company’s interest-sensitivity position increased net interest income by $151.5 million in 2004, $64.0 million in 2003, decreased net interest income $50.4
million in 2002, $37.4 million in 2001, and $0.5 million in 2000, and increased net interest income by $16.3 million in 1999.