SunTrust 2004 Annual Report Download - page 53
Download and view the complete annual report
Please find page 53 of the 2004 SunTrust annual report below. You can navigate through the pages in the report by either clicking on the pages listed below, or by using the keyword search tool below to find specific information within the annual report.-
 1
1 -
2
-
3
-
4
-
5
-
6
-
7
-
8
-
9
-
10
-
11
-
12
-
13
-
14
-
15
-
16
-
17
-
18
-
19
-
20
-
21
-
22
-
23
-
24
-
25
-
26
-
27
-
28
-
29
-
30
-
31
-
32
-
33
-
34
-
35
-
36
-
37
-
38
-
39
-
40
-
41
-
42
-
 43
43 -
 44
44 -
 45
45 -
 46
46 -
 47
47 -
 48
48 -
 49
49 -
 50
50 -
 51
51 -
 52
52 -
 53
53 -
 54
54 -
 55
55 -
 56
56 -
 57
57 -
 58
58 -
 59
59 -
 60
60 -
 61
61 -
 62
62 -
 63
63 -
64
-
65
-
66
-
67
-
68
-
69
-
70
-
71
-
72
-
73
-
74
-
75
-
76
-
77
-
78
-
79
-
80
-
81
-
82
-
83
-
84
-
85
-
86
-
87
-
88
-
89
-
90
-
91
-
92
-
93
-
94
-
95
-
96
-
97
-
98
-
99
-
100
-
101
-
102
-
103
-
104
-
105
-
106
-
107
-
108
-
109
-
110
-
111
-
112
-
113
-
114
-
115
-
116
 |
 |

MANAGEMENT’S DISCUSSION continued
SUNTRUST 2004 ANNUAL REPORT 51
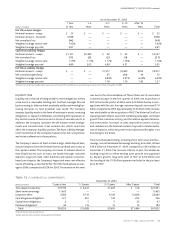
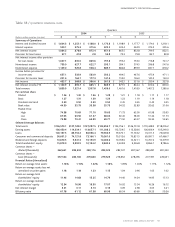
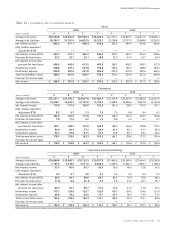
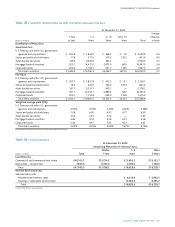
Table 18 / QUARTERLY FINANCIAL DATA
Quarters
2004 2003
(Dollars in millions except per share data) 4321 4321
Summary of Operations
Interest and dividend income $ 1,604.3 $ 1,252.1 $ 1,188.0 $ 1,173.8 $ 1,198.9 $ 1,177.7 $ 1,174.0 $ 1,218.1
Interest expense 520.1 375.3 315.6 322.2 333.4 344.9 374.5 395.6
Net interest income 1,084.2 876.8 872.4 851.6 865.5 832.8 799.5 822.5
Provision for loan losses 37.1 41.8 2.8 53.8 70.3 79.8 82.7 80.8
Net interest income after provision
for loan losses 1,047.1 835.0 869.6 797.8 795.2 753.0 716.8 741.7
Noninterest income 759.0 627.7 622.7 595.1 584.1 574.5 596.8 547.6
Noninterest expense 1,149.0 929.8 928.4 889.7 884.8 859.9 837.7 818.2
Income before provision for
income taxes 657.1 532.9 563.9 503.2 494.5 467.6 475.9 471.1
Provision for income taxes 201.4 164.1 177.3 141.4 152.0 136.0 145.5 143.3
Net income $ 455.7 $ 368.8 $ 386.6 $ 361.8 $ 342.5 $ 331.6 $ 330.4 $ 327.8
Net interest income-FTE $ 1,100.9 $ 893.7 $ 885.1 $ 863.9 $ 877.5 $ 844.4 $ 810.4 $ 833.0
Total revenue 1,859.9 1,521.4 1,507.8 1,459.0 1,461.6 1,418.9 1,407.2 1,380.6
Per common share
Diluted $ 1.26 $ 1.30 $ 1.36 $ 1.28 $ 1.21 $ 1.18 $ 1.17 $ 1.17
Basic 1.27 1.31 1.39 1.29 1.23 1.19 1.19 1.18
Dividends declared 0.50 0.50 0.50 0.50 0.45 0.45 0.45 0.45
Book value 44.30 35.79 35.58 35.75 34.52 32.83 32.62 31.06
Market Price:
High 74.38 70.69 71.10 76.65 71.73 63.00 61.98 59.95
Low 67.03 63.50 61.27 68.04 60.45 58.00 51.44 51.73
Close 73.88 70.41 64.99 69.71 71.50 60.37 59.34 52.65
Selected Average Balances
Total assets $156,570.1 $127,128.0 $127,287.5 $123,853.7 $124,756.1 $126,701.8 $119,448.0 $118,276.2
Earning assets 136,450.4 114,334.1 113,657.1 111,038.2 112,729.5 112,328.6 106,606.4 105,249.0
Loans 100,137.5 83,753.2 80,936.4 79,904.9 79,370.1 77,733.2 74,311.5 73,049.8
Consumer and commercial deposits 90,601.5 74,121.8 73,166.1 70,361.0 70,312.6 70,851.5 69,097.1 67,466.7
Brokered and foreign deposits 10,670.5 9,341.3 10,153.9 10,000.6 10,769.6 10,521.1 10,707.2 10,379.9
Total shareholders’ equity 15,819.0 9,992.9 10,194.2 9,840.3 9,435.8 9,236.8 8,864.1 8,786.6
Common shares –
diluted (thousands) 362,661 283,502 283,116 283,523 282,537 281,567 280,287 281,330
Common shares –
basic (thousands) 357,524 280,185 279,840 279,523 278,852 278,296 277,397 278,631
Financial Ratios (Annualized)
Return on average total assets 1.16% 1.15% 1.22% 1.18% 1.09% 1.04% 1.11% 1.12%
Return on average assets less net
unrealized securities gains 1.18 1.18 1.23 1.15 1.04 0.96 1.03 1.02
Return on average total
shareholders’ equity 11.46 14.68 15.25 14.79 14.40 14.24 14.95 15.13
Return on average realized
shareholders’ equity 12.54 16.96 18.30 17.07 16.02 15.54 16.26 16.12
Net interest margin 3.21 3.11 3.13 3.13 3.09 2.98 3.05 3.21
Efficiency ratio 61.78 61.12 61.58 60.98 60.54 60.60 59.53 59.26