SunTrust 2004 Annual Report Download - page 32
Download and view the complete annual report
Please find page 32 of the 2004 SunTrust annual report below. You can navigate through the pages in the report by either clicking on the pages listed below, or by using the keyword search tool below to find specific information within the annual report.-
 1
1 -
2
-
3
-
4
-
5
-
6
-
7
-
8
-
9
-
10
-
11
-
12
-
13
-
14
-
15
-
16
-
17
-
18
-
19
-
20
-
21
-
 22
22 -
 23
23 -
 24
24 -
 25
25 -
 26
26 -
 27
27 -
 28
28 -
 29
29 -
 30
30 -
 31
31 -
 32
32 -
 33
33 -
 34
34 -
 35
35 -
 36
36 -
 37
37 -
 38
38 -
 39
39 -
 40
40 -
 41
41 -
 42
42 -
43
-
44
-
45
-
46
-
47
-
48
-
49
-
50
-
51
-
52
-
53
-
54
-
55
-
56
-
57
-
58
-
59
-
60
-
61
-
62
-
63
-
64
-
65
-
66
-
67
-
68
-
69
-
70
-
71
-
72
-
73
-
74
-
75
-
76
-
77
-
78
-
79
-
80
-
81
-
82
-
83
-
84
-
85
-
86
-
87
-
88
-
89
-
90
-
91
-
92
-
93
-
94
-
95
-
96
-
97
-
98
-
99
-
100
-
101
-
102
-
103
-
104
-
105
-
106
-
107
-
108
-
109
-
110
-
111
-
112
-
113
-
114
-
115
-
116
 |
 |

30 SUNTRUST 2004 ANNUAL REPORT
MANAGEMENT’S DISCUSSION continued
Trust and investment management income increased $84.4 million,
or 16.8%, compared to 2003 and retail investment services income
increased $31.0 million, or 19.2%, compared to the prior year.The
Wealth and Investment Management line of business analysis on
page 25 provides analysis related to these line items. In addition to
this analysis, NCF contributed $10.9 million of the increase in trust
and investment management income and $4.9 million of the
increase in retail investment services income. NCF’s assets under
advisement were $4.3 billion as of December 31, 2004.
Service charges on deposit accounts increased $56.9 million, or
8.9%, compared to 2003. Approximately $32.1 million of the
increase was attributable to NCF. Increased NSF/stop payment vol-
umes, increased pricing and other revenue enhancement initiatives
also contributed to the increase.
Other charges and fees increased $64.2 million, or 19.7%, com-
pared to 2003. Approximately$12.6 million of the increase was
attributable to NCF. Also contributing to the increase were
increases in insurance revenue and letter of credit fees.The increase
in insurance revenue was due to increased sales volume and the
acquisition of an insurance subsidiary of Lighthouse Financial
Services, Inc. in June 2003.The increase in letter of credit fees was
due to increased volumes.
Combined trading account profits and commissions and investment
banking income, SunTrust’s capital markets revenue sources,
increased $32.1 million, or 10.6%, compared to the prior year.The
NCF acquisition contributed approximately $10.7 million of the
increase.The remainder of the increase was primarily due to growth
in the equity capital markets business.The Company incurred net
securities losses during 2004 of $41.7 million compared to net
securities gains of $123.9 million in 2003.
Other noninterest income increased $164.6 million, or 133.3%,
compared to 2003.Approximately $18.9 million of the increase was
due to NCF. Combined mortgage production and servicing income
increased $96.3 million, or 351.8%, compared to 2003. Mortgage
servicing related income increased $188.6 million compared to
2003 primarily due to a decline in amortization of service rights
related to a decrease in mortgage prepayments. Mortgage produc-
tion income decreased $92.3 million compared to 2003 due to a
$12.9 billion decrease in production volume. Certain Affordable
Housing partnerships, which were consolidated as a result of the
Company becoming the general partner in the third quarter of
2003, resulted in an increase of $15.8 million compared to 2003.
NONINTEREST EXPENSE
Noninterest expense increased $496.4 million, or 14.6%, compared
to 2003. Approximately $184.5 million of the increase was attrib-
uted to the NCF acquisition including $28.4 million of merger-
related expenses for system conversions, project management,
conformity changes, and customer communications. Compared to
2003, total personnel expense increased $223.8 million, or 11.5%,
and included approximately $78.7 million related to NCF. The
remainder of the increase was primarily due to increased historical
SunTrust headcount, normal merit increases and increased incen-
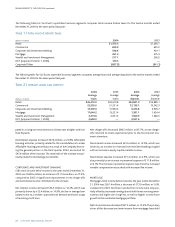
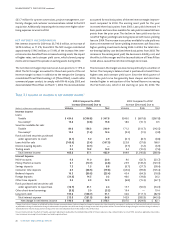
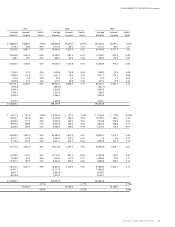
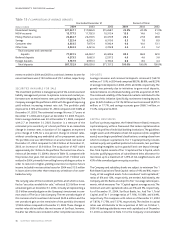
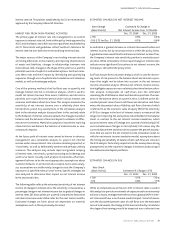
Table 6 / NONINTEREST EXPENSE
Year Ended December 31
(Dollars in millions) 2004 2003 2002 2001 2000 1999
Employee compensation $1,804.9 $1,585.9 $1,512.1 $1,484.5 $1,469.0 $1,522.6
Employee benefits 363.4 358.6 306.4 193.0 175.0 175.8
Total personnel expense 2,168.3 1,944.5 1,818.5 1,677.5 1,644.0 1,698.4
Net occupancy expense 268.2 237.3 229.3 210.4 202.6 197.4
Outside processing and software 286.3 246.7 225.2 199.1 172.3 150.3
Equipment expense 184.9 178.4 174.8 189.8 193.7 198.5
Marketing and customer development 128.3 100.3 80.0 104.0 106.2 105.4
Consulting and legal 81.0 57.4 91.1 87.7 59.6 62.5
Amortization of intangible assets 77.6 64.5 58.9 46.3 35.5 32.8
Postage and delivery 69.8 69.0 69.4 64.0 63.3 68.1
Communications 67.2 61.3 64.8 59.2 59.8 66.3
Credit and collection services 66.7 70.3 64.6 74.6 56.9 68.7
Other staff expense 66.0 60.4 52.0 58.5 51.5 50.1
Operating supplies 46.8 39.8 46.8 48.3 47.3 51.9
Merger-related expense 28.4 — 16.0 — 42.4 45.6
FDIC premiums 19.5 18.0 17.4 16.0 13.5 18.1
Other real estate income (1.8) (2.0) (0.1) (4.2) (3.8) (4.8)
Other expense 339.8 254.7 210.7 168.7 83.7 96.0
Total noninterest expense $3,897.0 $3,400.6 $3,219.4 $2,999.9 $2,828.5 $2,905.3
Year over year growth rate 14.6% 5.6% 7.3% 6.1% (2.6%)
Efficiency ratio 61.4% 60.0% 58.0% 56.1% 57.5% 60.4%