SunTrust 2004 Annual Report Download - page 38
Download and view the complete annual report
Please find page 38 of the 2004 SunTrust annual report below. You can navigate through the pages in the report by either clicking on the pages listed below, or by using the keyword search tool below to find specific information within the annual report.-
 1
1 -
2
-
3
-
4
-
5
-
6
-
7
-
8
-
9
-
10
-
11
-
12
-
13
-
14
-
15
-
16
-
17
-
18
-
19
-
20
-
21
-
22
-
23
-
24
-
25
-
26
-
27
-
 28
28 -
 29
29 -
 30
30 -
 31
31 -
 32
32 -
 33
33 -
 34
34 -
 35
35 -
 36
36 -
 37
37 -
 38
38 -
 39
39 -
 40
40 -
 41
41 -
 42
42 -
 43
43 -
 44
44 -
 45
45 -
 46
46 -
 47
47 -
 48
48 -
49
-
50
-
51
-
52
-
53
-
54
-
55
-
56
-
57
-
58
-
59
-
60
-
61
-
62
-
63
-
64
-
65
-
66
-
67
-
68
-
69
-
70
-
71
-
72
-
73
-
74
-
75
-
76
-
77
-
78
-
79
-
80
-
81
-
82
-
83
-
84
-
85
-
86
-
87
-
88
-
89
-
90
-
91
-
92
-
93
-
94
-
95
-
96
-
97
-
98
-
99
-
100
-
101
-
102
-
103
-
104
-
105
-
106
-
107
-
108
-
109
-
110
-
111
-
112
-
113
-
114
-
115
-
116
 |
 |

36 SUNTRUST 2004 ANNUAL REPORT
MANAGEMENT’S DISCUSSION continued
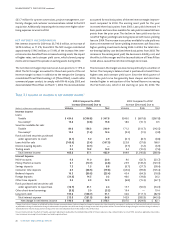
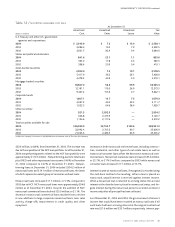
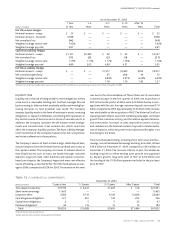
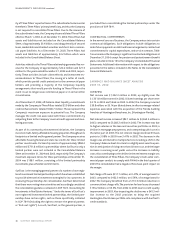
Table 13 / COMPOSITION OF AVERAGE DEPOSITS
Year Ended December 31 Percent of Total
(Dollars in millions) 2004 2003 2002 2004 2003 2002
Noninterest bearing $21,047.1 $17,826.9 $15,268.1 24.2% 22.3% 21.5%
NOW accounts 13,777.5 11,702.0 10,315.4 15.8 14.6 14.5
Money Market accounts 22,864.7 22,218.5 20,470.9 26.2 27.8 28.8
Savings 7,225.4 6,259.3 6,310.0 8.3 7.8 8.9
Consumer time 8,333.5 7,975.4 9,342.4 9.6 10.0 13.1
Other time 3,843.3 3,461.6 3,722.8 4.4 4.3 5.2
Total consumer and commercial
deposits 77,091.5 69,443.7 65,429.6 88.5 86.8 92.0
Brokered deposits 4,273.5 3,662.0 2,537.2 4.9 4.6 3.6
Foreign deposits 5,767.9 6,933.3 3,190.4 6.6 8.6 4.4
Total deposits $87,132.9 $80,039.0 $71,157.2 100.0% 100.0% 100.0%
ments recorded in 2004 and 2003 as cash basis interest income for
nonaccrual loans were $19.0 million and $14.1 million, respectively.
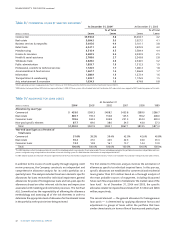
SECURITIES AVAILABLE FOR SALE
The investment portfolio is managed as part of the overall asset and
liability management process to optimize income and market per-
formance over an entire interest rate cycle while mitigating risk.The
Company managed the portfolio in 2004 with the goal of improving
yield without increasing interest rate risk. The portfolio yield
improved to 4.16% at December 31, 2004 compared with 3.66% at
December 31, 2003. The estimated average life was 3.7 years at
December 31, 2004 and 4.0 years at December 31, 2003.The port-
folio’s average duration was 3.0 at December 31, 2004, compared
with 2.7 at December 31, 2003. Duration is a measure of the
estimated price sensitivity of a bond portfolio to an immediate
change in interest rates. A duration of 3.0 suggests an expected
price change of 3.0% for a one percent change in interest rates,
without considering any embedded call or prepayment options.
The portfolio size was $26.9 billion on an amortized cost basis at
December 31, 2004 compared to $23.0 billion at December 31,
2003, an increase of $3.9 billion. The acquisition of NCF added
approximately $6.1 billion to the portfolio.The current mix of secu-
rities as of December 31, 2004 is shown in Table 12, compared with
the previous two years. Net securities losses of $41.7 million were
realized in 2004, primarily from selling lower-yielding securities in
order to reinvest in higher-yielding securities to improve future
income. Included in net securities losses for 2004 was $15.3 million
in losses due to the other than temporary writedown of an asset-
backed security.
The carrying value of the investment portfolio, all of which is classi-
fied as “securities available for sale,” reflected $2.0 billion in net
unrealized gains at December 31, 2004, virtually all representing a
$2.0 billion unrealized gain on the Company’s investment in com-
mon stock of The Coca-Cola Company.The net unrealized gain of
this common stock investment decreased $445.6 million and the
net unrealized gain on the remainder of the portfolio decreased
$158.8 million compared to December 31, 2003.These changes in
market value did not affect the net income of SunTrust, however,
the after tax effects were included in other comprehensive income.
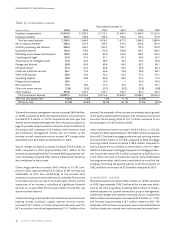
DEPOSITS
Average consumer and commercial deposits increased $7,647.8
million, or 11.0%, in 2004 and comprised 88.5%, 86.8%, and 92.0%
of average total deposits in 2004, 2003, and 2002, respectively.The
growth was primarily due to initiatives to grow retail deposits,
reduced reliance on wholesale funding, and the acquisition of NCF.
The continued volatility of the financial markets contributed to the
success of this initiative. Specifically, noninterest-bearing deposits
grew $3,220.2 million, or 18.1%, NOW accounts increased $2,075.5
million, or 17.7%, and savings accounts grew $966.1 million, or
15.4%, compared to 2003.
CAPITAL RESOURCES
SunTrust’s primary regulator, the Federal Reserve Board, measures
capital adequacy within a framework that makes capital sensitive
to the risk profiles of individual banking institutions.The guidelines
weight assets and off-balance sheet risk exposures (risk-weighted
assets) according to predefined classifications, creating a base from
which to compare capital levels.Tier 1 Capital primarily includes
realized equity and qualified preferred instruments, less purchase
accounting intangibles such as goodwill and core deposit intangi-
bles.Total Capital consists of Tier 1 Capital and Tier 2 Capital, which
includes qualifying portions of subordinated debt, allowance for
loan losses up to a maximum of 1.25% of risk-weighted assets, and
45% of the unrealized gain on equity securities.
The Company and subsidiary banks are subject to minimum Tier 1
Risk-Based Capital and Total Capital ratios of 4% and 8%, respec-
tively, of risk weighted assets.To be considered “well capitalized,”
ratios of 6% and 10%, respectively, are needed.Additionally, the
Company and the Banks are subject to Tier 1 Leverage ratio require-
ments, which measures Tier 1 Capital against average assets.The
minimum and well capitalized ratios are 3% and 5%, respectively.
As of December 31, 2004, SunTrust Banks, Inc. had Tier 1, Total
Capital, and Tier 1 Leverage ratios of 7.16%, 10.36%, and 6.64%,
respectively. This compares with ratios as of December 31, 2003
of 7.85%, 11.75%, and 7.37%, respectively.The decline in capital
ratios was attributable to the acquisition of NCF on October 1,
2004. All banking subsidiaries were well capitalized as of December
31, 2004 as detailed in Note 14 to the Company’s Consolidated