SunTrust 2004 Annual Report Download - page 90
Download and view the complete annual report
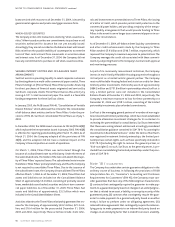
Please find page 90 of the 2004 SunTrust annual report below. You can navigate through the pages in the report by either clicking on the pages listed below, or by using the keyword search tool below to find specific information within the annual report.-
 1
1 -
2
-
3
-
4
-
5
-
6
-
7
-
8
-
9
-
10
-
11
-
12
-
13
-
14
-
15
-
16
-
17
-
18
-
19
-
20
-
21
-
22
-
23
-
24
-
25
-
26
-
27
-
28
-
29
-
30
-
31
-
32
-
33
-
34
-
35
-
36
-
37
-
38
-
39
-
40
-
41
-
42
-
43
-
44
-
45
-
46
-
47
-
48
-
49
-
50
-
51
-
52
-
53
-
54
-
55
-
56
-
57
-
58
-
59
-
60
-
61
-
62
-
63
-
64
-
65
-
66
-
67
-
68
-
69
-
70
-
71
-
72
-
73
-
74
-
75
-
76
-
77
-
78
-
79
-
 80
80 -
 81
81 -
 82
82 -
 83
83 -
 84
84 -
 85
85 -
 86
86 -
 87
87 -
 88
88 -
 89
89 -
 90
90 -
 91
91 -
 92
92 -
 93
93 -
 94
94 -
 95
95 -
 96
96 -
 97
97 -
 98
98 -
 99
99 -
 100
100 -
101
-
102
-
103
-
104
-
105
-
106
-
107
-
108
-
109
-
110
-
111
-
112
-
113
-
114
-
115
-
116
 |
 |

88 SUNTRUST 2004 ANNUAL REPORT
NOTES TO CONSOLIDATED FINANCIAL STATEMENTS continued
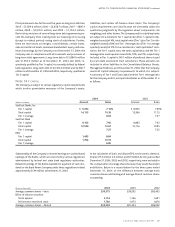
(Dollars in thousands) 2004 2003
Deferred tax assets
Allowance for loan losses $ 399,436 $ 342,510
Accrued expenses 98,252 76,522
Other 124,430 97,462
Gross deferred tax assets $ 622,118 $ 516,494
Deferred tax liabilities
Net unrealized gains on securities available for sale 649,688 847,538
Leasing 769,630 677,515
Employee benefits 248,374 248,225
Mortgage 146,858 118,379
Intangible assets 77,820 20,757
Fixed assets 48,509 65,159
Loans 53,959 41,518
Gross deferred tax liabilities $1,994,838 $2,019,091
Net deferred tax liability $1,372,720 $1,502,597
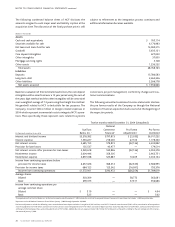
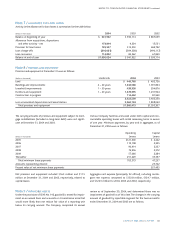
Note 15 / INCOME TAXES
The components of income tax expense (benefit) included in the Consolidated Statements of Income were as follows:
(Dollars in thousands) 2004 2003 2002
Current income tax expense (benefit)
Federal $517,508 $381,250 $360,851
State 21,629 15,686 (15,662)
Total $539,137 $396,936 $345,189
Deferred income tax expense
Federal 123,883 154,348 121,319
State 21,105 25,557 25,007
Total $144,988 $179,905 $146,326
Total income tax expense $684,125 $576,841 $491,515
The Company’s income from international operations, before
provision for income taxes, was not significant. Additionally, the
tax effect of unrealized gains and losses on securities available
for sale was recorded in other comprehensive income and had
no effect on income tax expense.
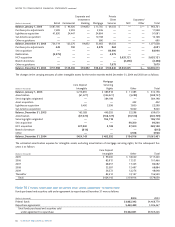
A reconciliation of the expected income tax expense at the
statutory federal income tax rate of 35% to the Company’s
actual income tax expense (benefit) and effective tax rate for
the past three years is as follows:
Deferred income tax liabilities and assets result from differences
between assets and liabilities measured for financial reporting pur-
poses and for income tax return purposes. These assets and liabili-
ties are measured using the enacted tax rates and laws that are
currently in effect. The significant components of the net deferred
tax liability are as follows:
2004 2003 2002
Percent Percent Percent
of Pre-Tax of Pre-Tax of Pre-Tax
(Dollars in thousands) Amount Income Amount Income Amount Income
Income tax expense at federal statutory rate $789,959 35.0% $668,198 35.0% $638,163 35.0%
Increase (decrease) resulting from:
Tax-exempt interest (38,610) (1.7%) (31,951) (1.7%) (29,366) (1.6%)
Income tax credits, net (51,264) (2.3%) (39,653) (2.1%) (51,243) (2.8%)
State income taxes, net of federal benefit 27,777 1.2% 26,807 1.4% 6,074 0.3%
Dividends on subsidiary preferred stock (23,037) (1.0%) (23,567) (1.2%) (25,530) (1.4%)
Reversal of deferred liability — 0.0% — 0.0% (25,000) (1.4%)
Other (20,700) (0.9%) (22,993) (1.2%) (21,583) (1.1%)
Total income tax expense and rate $684,125 30.3% $576,841 30.2% $491,515 27.0%