SunTrust 2004 Annual Report Download - page 83
Download and view the complete annual report
Please find page 83 of the 2004 SunTrust annual report below. You can navigate through the pages in the report by either clicking on the pages listed below, or by using the keyword search tool below to find specific information within the annual report.-
 1
1 -
2
-
3
-
4
-
5
-
6
-
7
-
8
-
9
-
10
-
11
-
12
-
13
-
14
-
15
-
16
-
17
-
18
-
19
-
20
-
21
-
22
-
23
-
24
-
25
-
26
-
27
-
28
-
29
-
30
-
31
-
32
-
33
-
34
-
35
-
36
-
37
-
38
-
39
-
40
-
41
-
42
-
43
-
44
-
45
-
46
-
47
-
48
-
49
-
50
-
51
-
52
-
53
-
54
-
55
-
56
-
57
-
58
-
59
-
60
-
61
-
62
-
63
-
64
-
65
-
66
-
67
-
68
-
69
-
70
-
71
-
72
-
 73
73 -
 74
74 -
 75
75 -
 76
76 -
 77
77 -
 78
78 -
 79
79 -
 80
80 -
 81
81 -
 82
82 -
 83
83 -
 84
84 -
 85
85 -
 86
86 -
 87
87 -
 88
88 -
 89
89 -
 90
90 -
 91
91 -
 92
92 -
 93
93 -
94
-
95
-
96
-
97
-
98
-
99
-
100
-
101
-
102
-
103
-
104
-
105
-
106
-
107
-
108
-
109
-
110
-
111
-
112
-
113
-
114
-
115
-
116
 |
 |

NOTES TO CONSOLIDATED FINANCIAL STATEMENTS continued
SUNTRUST 2004 ANNUAL REPORT 81
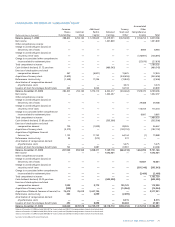
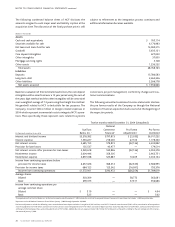
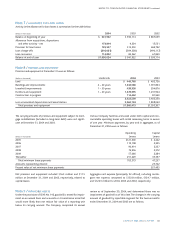
Note 5 / SECURITIES AVAILABLE FOR SALE
Securities available for sale at December 31 were as follows:
2004
Amortized Unrealized Unrealized Fair
(Dollars in thousands) Cost Gains Losses Value
U.S.Treasury and other U.S. government
agencies and corporations $ 2,543,917 $ 7,246 $ 13,039 $ 2,538,124
States and political subdivisions 841,605 25,118 1,126 865,597
Asset-backed securities 2,590,001 7,616 19,090 2,578,527
Mortgage-backed securities 18,366,981 58,160 99,806 18,325,335
Corporate bonds 1,667,077 19,719 7,494 1,679,302
Common stock of The Coca-Cola Company 110 2,003,796 — 2,003,906
Other securities 921,224 29,065 — 950,289
Total securities available for sale $26,930,915 $2,150,720 $140,555 $28,941,080
2003
Amortized Unrealized Unrealized Fair
(Dollars in thousands) Cost Gains Losses Value
U.S.Treasury and other U.S. government
agencies and corporations $ 2,286,427 $ 13,959 $ 7,872 $ 2,292,514
States and political subdivisions 362,995 17,807 271 380,531
Asset-backed securities 5,417,882 36,175 26,071 5,427,986
Mortgage-backed securities 12,181,073 119,342 26,934 12,273,481
Corporate bonds 2,097,218 43,966 29,513 2,111,671
Common stock of The Coca-Cola Company 110 2,449,415 — 2,449,525
Other securities 646,667 24,509 — 671,176
Total securities available for sale $22,992,372 $2,705,173 $90,661 $25,606,884
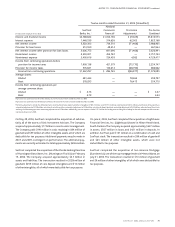
The amortized cost and fair value of investments in debt securities at December 31, 2004 by estimated average life are shown below. Actual
cash flows will differ from estimated average lives and contractual maturities because borrowers may have the right to call or prepay obli-
gations with or without call or prepayment penalties.
Amortized Fair
(Dollars in thousands) Cost Value
Due in one year or less $ 1,624,909 $ 1,636,102
Due in one year through five years 19,760,341 19,692,940
Due after five years through ten years 4,296,747 4,325,398
After ten years 327,584 332,445
Total $26,009,581 $25,986,885
Proceeds from the sale of investments in debt securities were
$8.9 billion, $7.6 billion and $5.6 billion in 2004, 2003, and 2002,
respectively.Gross realized gains were $16.5 million,$124.9 million,
and $206.5 million and gross realized losses on such sales were
$58.2 million, $1.0 million, and $2.0 million in 2004, 2003, and
2002, respectively.
Securities available for sale that were pledged to secure public
deposits, trust, and other funds had fair values of $17.4 billion,
$13.7 billion, and $14.2 billion at December 31, 2004, 2003, and
2002, respectively.