SunTrust 2004 Annual Report Download - page 50
Download and view the complete annual report
Please find page 50 of the 2004 SunTrust annual report below. You can navigate through the pages in the report by either clicking on the pages listed below, or by using the keyword search tool below to find specific information within the annual report.-
 1
1 -
2
-
3
-
4
-
5
-
6
-
7
-
8
-
9
-
10
-
11
-
12
-
13
-
14
-
15
-
16
-
17
-
18
-
19
-
20
-
21
-
22
-
23
-
24
-
25
-
26
-
27
-
28
-
29
-
30
-
31
-
32
-
33
-
34
-
35
-
36
-
37
-
38
-
39
-
 40
40 -
 41
41 -
 42
42 -
 43
43 -
 44
44 -
 45
45 -
 46
46 -
 47
47 -
 48
48 -
 49
49 -
 50
50 -
 51
51 -
 52
52 -
 53
53 -
 54
54 -
 55
55 -
 56
56 -
 57
57 -
 58
58 -
 59
59 -
 60
60 -
61
-
62
-
63
-
64
-
65
-
66
-
67
-
68
-
69
-
70
-
71
-
72
-
73
-
74
-
75
-
76
-
77
-
78
-
79
-
80
-
81
-
82
-
83
-
84
-
85
-
86
-
87
-
88
-
89
-
90
-
91
-
92
-
93
-
94
-
95
-
96
-
97
-
98
-
99
-
100
-
101
-
102
-
103
-
104
-
105
-
106
-
107
-
108
-
109
-
110
-
111
-
112
-
113
-
114
-
115
-
116
 |
 |

48 SUNTRUST 2004 ANNUAL REPORT
MANAGEMENT’S DISCUSSION continued
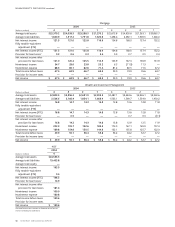
CORPORATE AND INVESTMENT BANKING
CIB’s total income before taxes for the year ended December 31,
2003 was $424.1 million, an increase of $168.0 million, or 65.6%,
compared to 2002. A significant decline in net charge-offs con-
tributed to the increase.
Net interest income increased $16.5 million, or 5.9%.Three Pillars
was consolidated in the third quarter of 2003.This consolidation
had an average loan impact of approximately $1.1 billion compared
to 2002. Growth in deposits and lease balances also contributed to
the increase.
Net charge-offs decreased $126.5 million, or 52.4%, as charge-offs
returned to levels experienced prior to the most recent economic
downturn.
Noninterest income increased $21.0 million, or 4.0%, which was
driven by an increase in fixed income sales, derivatives, and foreign
exchange fees.Also contributing to the overall increase in profitabil-
ity was a $4.0 million, or 1.3%, decline in noninterest expense.
MORTGAGE
Mortgage’s total income before taxes for the year ended December
31, 2003 was $275.3 million, an increase of $103.4 million, or
60.2%, compared to 2002. Higher production and residential port-
folio earnings more than offset increases in mortgage servicing
rights amortization.
Net interest income increased $173.0 million, or 43.3%.The princi-
pal drivers of the higher net interest income were income from
mortgage loans held for sale and income from portfolio loans.
Mortgage loans held for sale increased $3.6 billion, or 83.0%.The
volume increase produced net interest income of $330.2 million, an
increase of $128.9 million, or 64.0%. Additionally, total loans, prin-
cipally residential mortgages, were up $1.1 billion, or 9.4%.
Combined with wider margins, net interest income on loans
increased $35.6 million, or 20.7%.
Net charge-offs increased $0.5 million, or 26.7%. Noninterest
income increased $4.3 million, or 295.2%.The noninterest income
increase was driven by higher production income which was only
partially offset by lower servicing income. Production income of
$151.0 million was up $57.6 million, or 61.6%, principally due to
fees from higher production, increased sales to the secondary mar-
ket and better secondary marketing performance. Mortgage loan
production increased 41.9% to $43.7 billion from $30.8 billion.
Servicing income declined $67.6 million, or 58.9%. The decline
in servicing income was primarily the result of higher mortgage
servicing rights amortization resulting from higher prepayments of
mortgage loans.
Noninterest expense increased $73.3 million, or 32.2%. This
increase was principally driven by higher volume related expense,
such as commissions and costs associated with processing and
closing loans.
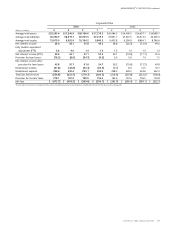
WEALTH AND INVESTMENT MANAGEMENT
Wealth and Investment Management’s total income before taxes
for the year ended December 31, 2003 was $200.2 million, a
decrease of $0.6 million, or 0.3%, compared to 2002.
Net interest income increased $4.9 million, or 10.4%.The growth
was primarily due to an increase of $410.6 million, or 25.8%, in
average loan balances.
Noninterest income increased $34.0 million, or 5.4%, which was
mainly driven by increased retail investment income.The increase in
retail investment income was primarily due to an increase in broker
production, an increase in the number of brokers, and increased rev-
enue generated from Alexander Key.Although average assets under
management increased 4.1% compared to 2002, trust and invest-
ment management income decreased slightly compared to 2002.
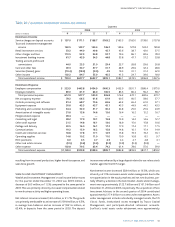
As of December 31, 2003, SunTrust’s total assets under advisement
were approximately $180.9 billion, which included $101.0 billion in
assets under management, $21.8 billion in non-managed corporate
trust assets, $35.9 billion in non-managed trust assets, and $22.2
billion in retail brokerage assets.Assets under management include
individually managed assets, the STI Classic Funds, institutional
assets managed by Trusco Capital Management, and participant-
directed retirement accounts.
Noninterest expense increased $38.7 million, or 8.1%. Increased
commissions and incentives from new business activity in SunTrust
Securities and Alexander Key were the main drivers, with increases
in employee benefits expense also contributing.
CORPORATE/OTHER
Corporate/Other’s loss before taxes for the year ended December
31, 2003 was a loss of $841.3 million, compared to a loss of $407.4
million for 2002.
Net interest income declined $290.3 million, or 86.5%, in 2003
compared to the prior year. The major reasons for the decline were
lower interest rates compressing the margin earned on liabilities
and capital and lower margin earned on the investment portfolio.
The 2003 provision for loan losses was $38.2 million, or 89.5%, less
than the 2002 provision.The reduction was due to improved credit
quality and the difference between the Company’s consolidated
provision and net charge-offs.
Noninterest income declined $128.0 million, or 79.6%, in 2003
compared to the prior year.The decline was a result of a reduction in
securities gains and higher transfers to the Commercial line of busi-
ness for tax credits generated by Affordable Housing.