SunTrust 2004 Annual Report Download - page 45
Download and view the complete annual report
Please find page 45 of the 2004 SunTrust annual report below. You can navigate through the pages in the report by either clicking on the pages listed below, or by using the keyword search tool below to find specific information within the annual report.
MANAGEMENT’S DISCUSSION continued
SUNTRUST 2004 ANNUAL REPORT 43
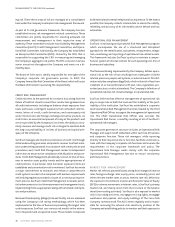
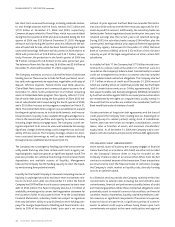
LIQUIDITY RISK
Liquidity risk is the risk of being unable to meet obligations as they
come due at a reasonable funding cost. SunTrust manages this risk
by structuring its balance sheet prudently and by maintaining bor-
rowing resources to fund potential cash needs. The Company
assesses liquidity needs in the form of increases in assets, maturing
obligations, or deposit withdrawals, considering both operations in
the normal course of business and in times of unusual events. In
addition, the Company considers the off-balance sheet arrange-
ments and commitments it has entered into, which could also
affect the Company’s liquidity position.The Asset Liability Manage-
ment Committee of the Company measures this risk, sets policies,
and reviews adherence to those policies.
The Company’s sources of funds include a large, stable deposit base,
secured advances from the Federal Home Loan Bank and access to
the capital markets.The Company structures its balance sheet so
that illiquid assets, such as loans, are funded through customer
deposits, long-term debt, other liabilities and capital. Customer-
based core deposits, the Company’s largest and most cost-effective
source of funding, accounted for 66.1% of the funding base on aver-
age for 2004, compared to 65.2% for 2003.The increase in this ratio
was due to the deconsolidation of Three Pillars and its associated
commercial paper in the first quarter of 2004, the acquisition of
NCF in the fourth quarter of 2004, and a $3.2 billion decline in aver-
age loans held for sale. Average customer deposits increased $7.6
billion compared to 2003.Approximately $3.5 billion of the increase
was attributable to the acquisition of NCF. The historical SunTrust
deposit growth reflects successful marketing campaigns, continued
growth from customer activity, and the relative appeal of alterna-
tive investments. Increases in rates, improved economic activity
and confidence in the financial markets may lead to disintermedia-
tion of deposits, which may need to be replaced with higher cost
borrowings in the future.
Total net wholesale funding, including short-term unsecured bor-
rowings, secured wholesale borrowings and long-term debt, totaled
$43.6 billion at December 31, 2004, compared to $39.0 billion at
December 31, 2003. The increase reflects, in part, the wholesale
funding required to offset earning asset growth not supported
by deposit growth, long-term debt of NCF of $2.8 billion and
the funding of the $1.8 billion payment included in the purchase
price for NCF.
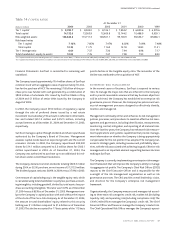
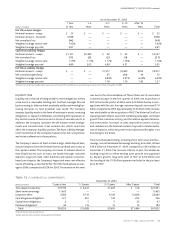
As of December 31, 2003
1 Year 1–2 2–5 5–10 After 10
(Dollars in millions) or Less Years Years Years Years Total
Fair Value Asset Hedges
Notional amount – swaps $ 25 $ — $ — $ — $ — $ 25
Notional amount – forwards13,938 — — — — 3,938
Net unrealized loss (44) — — — — (44)
Weighted average receive rate11.92% — — — — 1.92%
Weighted average pay rate 4.97 — — — — 4.97
Cash Flow Liability Hedges
Notional amount – swaps $1,101 $2,389 $ 22 $ 45 $ — $3,557
Net unrealized loss (15) (6) (2) (4) — (27)
Weighted average receive rate11.15% 1.17% 1.17% 1.16% — 1.16%
Weighted average pay rate14.89 2.02 4.38 4.51 — 2.95
Fair Value Liability Hedges
Notional amount – swaps $ — $ — $1,317 $3,650 $950 $5,917
Net unrealized gain (loss) — — 65 (34) 44 75
Weighted average receive rate1— — 4.84% 3.91% 6.23% 4.49%
Weighted average pay rate1— — 1.18 1.16 1.42 1.21
1All interest rate swaps have variable pay or receive rates with resets of three months or less, and are the pay or receive rates in effect at December 31, 2003.
Table 16 / CONTRACTUAL COMMITMENTS
December 31, 2004
(Dollars in millions) 1 year or less 1–3 years 3–5 years After 5 years Total
Time deposit maturities1$19,199 $ 6,247 $1,429 $ 516 $27,391
Short-term borrowings111,405 — — — 11,405
Long-term debt13,583 3,719 4,109 10,669 22,080
Operating lease obligations 121 201 132 252 706
Capital lease obligations 2 5 5 35 47
Purchase obligations240 116 15 12 183
Total $34,350 $10,288 $5,690 $11,484 $61,812
1Amounts do not include accrued interest.
2Includes contracts with a minimum annual payment of $5 million.


