SunTrust 2004 Annual Report Download - page 37
Download and view the complete annual report
Please find page 37 of the 2004 SunTrust annual report below. You can navigate through the pages in the report by either clicking on the pages listed below, or by using the keyword search tool below to find specific information within the annual report.-
 1
1 -
2
-
3
-
4
-
5
-
6
-
7
-
8
-
9
-
10
-
11
-
12
-
13
-
14
-
15
-
16
-
17
-
18
-
19
-
20
-
21
-
22
-
23
-
24
-
25
-
26
-
 27
27 -
 28
28 -
 29
29 -
 30
30 -
 31
31 -
 32
32 -
 33
33 -
 34
34 -
 35
35 -
 36
36 -
 37
37 -
 38
38 -
 39
39 -
 40
40 -
 41
41 -
 42
42 -
 43
43 -
 44
44 -
 45
45 -
 46
46 -
 47
47 -
48
-
49
-
50
-
51
-
52
-
53
-
54
-
55
-
56
-
57
-
58
-
59
-
60
-
61
-
62
-
63
-
64
-
65
-
66
-
67
-
68
-
69
-
70
-
71
-
72
-
73
-
74
-
75
-
76
-
77
-
78
-
79
-
80
-
81
-
82
-
83
-
84
-
85
-
86
-
87
-
88
-
89
-
90
-
91
-
92
-
93
-
94
-
95
-
96
-
97
-
98
-
99
-
100
-
101
-
102
-
103
-
104
-
105
-
106
-
107
-
108
-
109
-
110
-
111
-
112
-
113
-
114
-
115
-
116
 |
 |

MANAGEMENT’S DISCUSSION continued
SUNTRUST 2004 ANNUAL REPORT 35
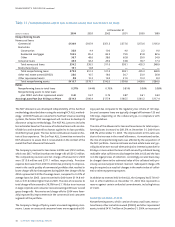
$32.6 million, or 8.6%, from December 31, 2003. The increase was
due to the acquisition of the NCF loan portfolio. As of December 31,
2004, nonperforming assets related to the NCF loan portfolio were
approximately $110.5 million. Nonperforming assets to total loans
plus OREO and other repossessed assets were 0.40% at December
31, 2004 compared to 0.47% at December 31, 2003. Nonper-
forming loans at December 31, 2004 included $354.2 million of
nonaccrual loans and $19.1 million of restructured loans, the latter
of which represents a select group of consumer workout loans.
Nonaccrual loans increased $17.7 million, or 5.3%, compared to
2003 due to NCF. NCF nonaccrual loans were approximately $94.8
million as of December 31, 2004. Despite the addition of NCF,
nonaccrual commercial loans declined $35.0 million, or 21.1%. The
decrease in nonaccrual commercial loans resulted from a decline
in new additions to large corporate nonaccrual loans, loan sales
activity, charge-offs, improvement in credit quality and client
repayment.
Increases in both nonaccrual real estate loans, including construc-
tion, residential, and other types of real estate loans, as well as
nonaccrual consumer loans offset the decrease in nonaccrual com-
mercial loans. Nonaccrual real estate loans increased $35.6 million,
or 25.7%, to $174.0 million, compared to 2003 while nonaccrual
consumer loans increased $17.1 million, or 53.1%.
Interest income on nonaccrual loans,if recognized, is recorded using
the cash basis method of accounting. When a loan is placed on
nonaccrual, unpaid interest is reversed against interest income.
When a nonaccrual loan is returned to accruing status, the accrued
interest at the date the loan is placed on nonaccrual status, and for-
gone interest during the nonaccrual period is recorded as interest
income only after all principal has been collected.
As of December 31, 2004 and 2003, the gross amount of interest
income that would have been recorded on nonaccrual loans if all
such loans had been accruing interest at the original contractual
rate was $21.6 million and $33.7 million, respectively. Interest pay-
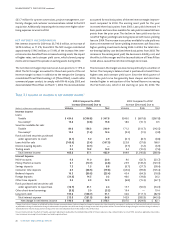
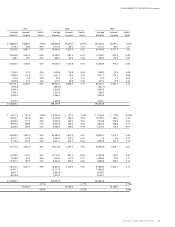
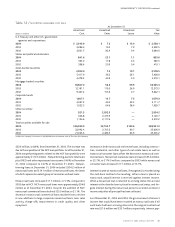
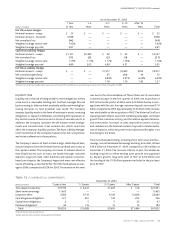
Table 12 / SECURITIES AVAILABLE FOR SALE
At December 31
Amortized Unrealized Unrealized Fair
(Dollars in millions) Cost Gains Losses Value
U.S.Treasury and other U.S. government
agencies and corporations
2004 $ 2,543.9 $ 7.2 $ 13.0 $ 2,538.1
2003 2,286.4 14.0 7.9 2,292.5
2002 3,601.5 82.9 0.4 3,684.0
States and political subdivisions
2004 841.6 25.1 1.1 865.6
2003 363.0 17.8 0.3 380.5
2002 398.6 20.9 0.4 419.1
Asset-backed securities
2004 2,590.0 7.6 19.1 2,578.5
2003 5,417.9 36.2 26.1 5,428.0
2002 4,478.2 44.9 5.0 4,518.1
Mortgage-backed securities
2004 18,367.0 58.2 99.9 18,325.3
2003 12,181.1 119.3 26.9 12,273.5
2002 9,467.2 155.6 0.7 9,622.1
Corporate bonds
2004 1,667.1 19.7 7.5 1,679.3
2003 2,097.2 44.0 29.5 2,111.7
2002 1,923.5 64.6 58.4 1,929.7
Other securities1
2004 921.3 2,032.9 — 2,954.2
2003 646.8 2,473.9 — 3,120.7
2002 1,154.6 2,117.6 — 3,272.2
Total securities available for sale
2004 $26,930.9 $2,150.7 $140.6 $28,941.0
2003 22,992.4 2,705.2 90.7 25,606.9
2002 21,023.6 2,486.5 64.9 23,445.2
1Includes the Company’s investment in 48,266,496 shares of common stock of The Coca-Cola Company.